Download
1 / 20
200 likes | 211 Vues
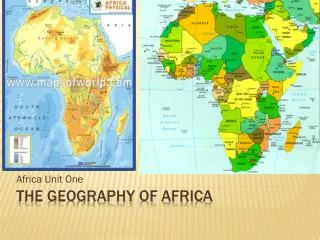
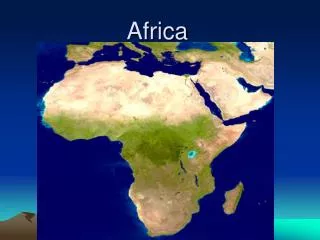
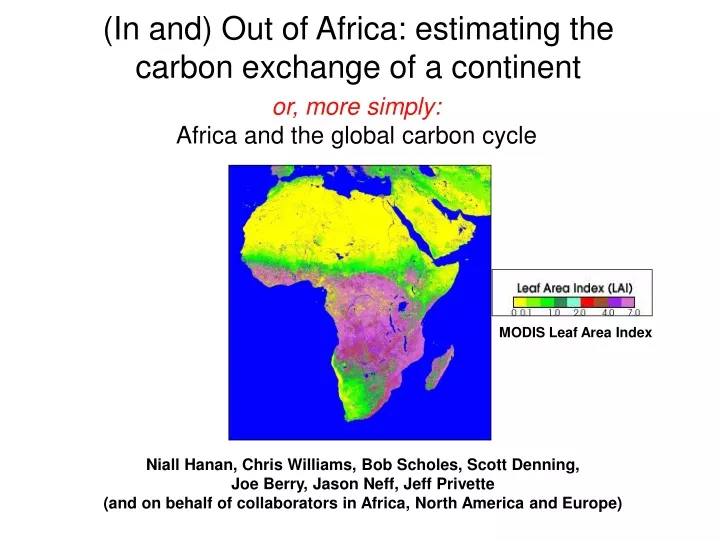
MODIS Leaf Area Index. (In and) Out of Africa: estimating the carbon exchange of a continent. or, more simply: Africa and the global carbon cycle. Niall Hanan, Chris Williams, Bob Scholes, Scott Denning, Joe Berry, Jason Neff, Jeff Privette

E N D
MODIS Leaf Area Index (In and) Out of Africa: estimating the carbon exchange of a continent or, more simply: Africa and the global carbon cycle Niall Hanan, Chris Williams, Bob Scholes, Scott Denning, Joe Berry, Jason Neff, Jeff Privette (and on behalf of collaborators in Africa, North America and Europe)
Acknowledgements • This research funded by: • National Oceanic and Atmospheric Administration (NOAA) - Office of Global Programs • National Aeronautics and Space Administration (NASA) - Terrestrial Ecology Program
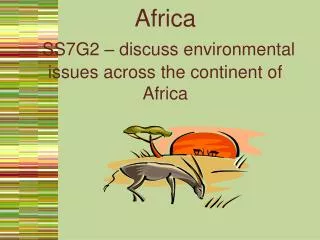
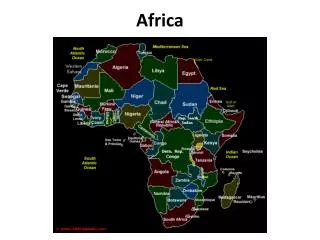
Africa: Vegetation and Climate Spatial distribution of land cover and annual rainfall (400 mm yr-1 intervals) Sources: UMD Global Land Cover Facility ~8km IGBP land cover types, and FAO global half degree PPT data.
What do we know about African carbon stocks and fluxes? • Plot/village scale inventory, growth and process studies, including CO2 fluxes and [CO2] • Regional-global scale biogeochemical (“forward”) models of stocks and/or fluxes (up-scaling of plot measurements, often using earth-observing satellites, and climatologies) • Regional-continental scale atmospheric inversions using the [CO2] observation network
What do we know ...1 • 1. Plot scale inventory, growth and process studies: • Much work using traditional forest, ag, and pastoral sector methods at governmental level; FAO; NGOs; Millenium Assessment; Kyoto baseline assessments, etc. • Often scattered / hard to find • Some efforts at synthesis and regionalization of soil and vegetation biomass, land use change… • Relatively few detailed process studies • But increasing… Brown, S., and G. Gaston. 1996. Tropical Africa: Land Use, Biomass, and Carbon Estimates For 1980. ORNL/CDIAC-92
What do we know…2Carbon inventory Statistics for Africa(summarized for 5o latitude bands) (c) (a) (b) Latitudinal distribution of (a) mean annual precipitation (mm y-1), (b) mean soil & plant carbon (kg C m-2), (c) annual NPP (g C m-2) Sources: (a) FAO PPT, (b) Olsen et al global live carbon and IGBP-DIS soil carbon, (c) CASA model and Potsdam model comparison results
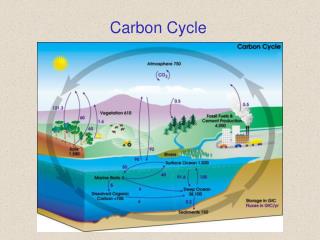
What do we know …2 2. Regional-global scale biogeochemical (“forward”) models of stocks and/or fluxes(often part of global assessments or simulations) Cramer et al., Potsdam model comparison: Annual NPP (carbon g m-2; average of all models) • Other examples: • Climatological & remote sensing based biogeochemical/process models • Anthropogenic fluxes - land use, domestic and wildfires – at national-continental scales • and so on…
What do we know …2 Monthly NPP mean and variability • Historical analysis of spatial and temporal variability for 4 study sites across rainfall gradient, using: • SiB2 land surface model • 1980-2002 AVHRR archive • Climate reanalysis data • Regional soil and vegetation data
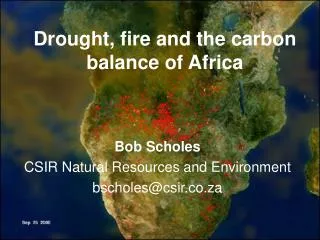
What do we know …2 Carbon Emissions from Fires ICDC7 Poster LU204: G.R. van der Werf, L.Giglio, G.J. Collatz, J.T. Randerson, P.S. Kasibhatla, and A.F. Arellano
Global totals Carbon Statistics for Africa(Fraction of Global totals) “Error bars” show range of published estimates (small range may reflect error convergence among models, as much as true confidence in the estimates!)
What do we know …3 3. Atmospheric Inversions of carbon source/sink distributions • TRANSCOM-3 Model comparison study • 11 terrestrial regions (2 in Africa) • 11 oceanic regions (after Gurney et al. 2004)
(a) Net CO2 flux, and (b) net CO2 flux per unit area for Africa and comparison regions Positive values indicate a surface source Boxes show the range of +/- 1 standard deviation from the IPCC 2001 for in the 1980s (dark) and 1990s (light) Symbols report results from inverse analyses of atmospheric [CO2] D = mean flux from individual inversion studies (error bars show the uncertainty) □ = mean flux estimate calculated from multiple source/sink estimates (Transcom inter-comparison) + = standard deviation among flux estimates (Transcom inter-comparison) o = average of individual uncertainty estimates (Transcom inter-comparison)
Why such uncertainty for Africa? Global [CO2] Observation Sites Global Eddy Flux (“Fluxnet”) Sites
What do we know about the C cycle of Africa? • We are aware that we don’t know much! • Uncertainty in quantifying the carbon cycle of Africa related primarily to lack of observations • This is more acute for Africa than most other regions of the world • Therefore, forward and inverse models are poorly constrained for Africa • But… • New research and observations beginning in Africa…
New research… Eddy flux and micrometeorology Near-surface precision CO2 and flask samplers Physiological and biogeochemical studies Soil CO2 flux and stable isotope composition
and Zambia Increasing Africa’s Representation in Global Carbon Cycle Observation Africa currently sparsely represented… but Afriflux and [CO2] observation network developing
Global Atmospheric Inversions • TRANSCOM Model-comparison • 11 terrestrial regions (2 in Africa) • 11 oceanic regions • (results after Gurney et al. 2002)
New terrestrial sampling sites Global Atmospheric Inversions • Impact of Adding African Precision [CO2] Stations on Inverse Solution Uncertainty • South Africa (operational) • Mali (Feb 2006) • Zambia (mid-2006) • Data from the new sites will contribute to atmospheric inversions starting 2005-06
Regional Carbon Flux Estimation using a PBL-budget approach with near-surface [CO2] and atmospheric transport Model results and animation from Joe Berry Betts, Helliker, and Berry, 2004, Coupling between CO2, water vapor, temperature and radon and their fluxes in an idealized equilibrium boundary layer over land. JGR, 109, D18103
Summary • Understanding African C cycle limited by observations • Inventory, forward & inverse methods: all data-poor for Africa • Unique aspects of the continent: fire; prevalence of semi-arid & C4 vegetation, land use patterns and land use change • Even given uncertainties it is clear that land use & fire fluxes far outweigh industrial emissions of the continent • New and expanding observational capacity - particularly the developing Afriflux network and continental [CO2] measurements - is beginning to redress this imbalance • Reducing uncertainty for Africa, using complementary approaches, will help reduce uncertainty for other regions and globally