Download
1 / 24
240 likes | 245 Vues
RECEPTOR MODELLING OF AIRBORNE PARTICULATE MATTER. Roy M Harrison Division of Environmental Health & Risk Management The University of Birmingham United Kingdom. RECEPTOR MODELLING OF PARTICULATE MATTER IN EUROPE BACKGROUND (1).

E N D
RECEPTOR MODELLING OF AIRBORNE PARTICULATE MATTER Roy M Harrison Division of Environmental Health & Risk Management The University of Birmingham United Kingdom
RECEPTOR MODELLING OF PARTICULATE MATTER IN EUROPEBACKGROUND (1) • CAFE Position Paper reports only results of studies based upon major component composition • Historically there have been a number of studies which have used multi-elemental analyses and multivariate statistics to apportion PM mass to major source categories. These studies are mostly over five years old and the results reflect emissions at the time of air sampling
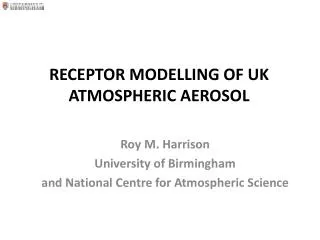
RECEPTOR MODELLING OF PARTICULATE MATTER IN EUROPEBACKGROUND (2) • The use of sophisticated receptor modelling methods is hampered by - a lack of multi-element datasets of sufficient length - adequate information on source profiles of inorganic constituents (for CMB) - the absence of a road traffic marker since the removal of lead from gasoline - a shortage of high quality EC/OC data - a lack of adequate information on the abundance of organic tracers in relevant source material
EUROPEAN STRENGTHS AND WEAKNESSES • Extensive high quality measurements of physical properties of airborne particles • Good international collaboration in data assessment • Scarcity of detailed information on aerosol chemical composition
RECEPTOR MODELLING OF PARTICULATE MATTER IN THE UNITED KINGDOM (1) • You can only use the data that you have! • QUALITY OF URBAN AIR REVIEW GROUP (1996) - estimated road traffic-derived particles from correlations with NOx and CO - estimated secondary inorganic PM from mass of sulphate and estimated nitrate/ sulphate ratios - assumed coarse particles (PM2.5 – 10) to be resuspended dust and sea salt
RECEPTOR MODELLING OF PARTICULATE MATTER IN THE UNITED KINGDOM (2) • THE AIRBORNE PARTICLES EXPERT GROUP (1999) developed a quantitative three component model PM10 (TEOM) = a.BS + b.SO42- + c where BS = black smoke a and b are coefficients determined by regression; c is an intercept representing “other”, mainly coarse particles • The model was subsequently refined (John Stedman, AEA Technology) - to estimate a road traffic contribution from national maps of nitrogen oxides - to include dispersion model results for emissions from non-traffic point and area sources
RECEPTOR MODELLING OF PARTICULATE MATTER IN THE UNITED KINGDOM (3) • The “pragmatic mass closure model” of Harrison et al (2003) offers greater refinement. - nitrate is included as well as sulphate - measurements of OC and EC allow estimation of primary and secondary organic carbon - coarse dusts are quantified through analysis of Cl- (sea salt), Fe and Ca - the method is directly applicable to manual gravimetric samples • Weaknesses include - inability to apportion the primary carbonaceous component - limited information on the sources of coarse “mineral” dusts
URBAN AIR QUALITY: PARTICULATE MATTER Which sources are important? SourceChemical tracer (bulk samples) Local traffic exhaust elemental carbon and organic compounds Long range transport - SO2 oxidation sulphates - NOx oxidation nitrates - ammonia emissions ammonium Soil and road dusts iron Construction and demolition calcium Sea salt sodium chloride
Adjustment Factors used in Mass Closure * After subtraction of sulphate derived from gypsum (CaSO4.2H2O) MISC48
Relationship of Reconstructed Mass and Gravimetric Particulate Matter Mass at the Roadside Sites MISC49
Composition of PM in the Urban Atmosphere(London and Birmingham 2000-2002) All sites - Background PM10 Samples = 151; Mean = 24.7 µg m-3 ammonium bound water sulphate 8% 14% dust (Fe) 19% ammonium and sodium nitrate 14% calcium salts 5% sodium chloride 8% elemental carbon organic 10% compounds 22%
Composition of PM in the Urban Atmosphere (London and Birmingham 2000-2002) All sites - Roadside PM10 Samples = 101; Mean = 35.7 µg m-3 ammonium bound water sulphate 6% 10% ammonium and dust (Fe) sodium nitrate 17% 9% sodium chloride 5% calcium salts 3% elemental carbon organic 27% compounds 23%
Comparison of PM Composition for Days with 10 -3 PM > 50 µg m with all Days: Urban background 10 70 ] -3 60 50 Days PM10 > 50 µg m-3 [n = 10] 40 Mean Concentration [µg m All days [n = 151] 30 20 10 0 Bound water nitrate Sodium Sodium chloride dust Iron rich Calcium sulphate carbon Elemental sulphate nitrate Ammonium Ammonium Organic compounds Mean mass
Comparison of PM Composition for Days with 10 -3 PM > 50 µg m with all Days: Urban background 10 ] -3 14 Days PM10 > 50 µg m-3 [n = 10] 12 All days [n = 151] 10 8 Mean Concentration [µg m 6 4 2 0 water Bound nitrate Sodium Sodium chloride Iron rich dust sulphate Calcium Elemental carbon nitrate sulphate Ammonium Ammonium Organic compounds
RECEPTOR MODELLING IN THE UNITED KINGDOM Clearly the eight-component model is not in itself sufficient to allow prediction of future PM concentrations. Additional refinements should include: • Estimation of secondary organic carbon and modelling of source-receptor relationships for SOC • Estimation of contributions to primary EC and OC • Using dispersion modelling • Understanding more fully the sources of the “iron-rich” and “calcium –rich” dust components. • Modelling source-receptor relationships for sulphate and nitrate, including possible effects of changing ammonia emissions.
RECEPTOR MODELLING OF AIRBORNE PARTICULATE MATTER • Use of the TSI AEROSOL TIME-OF-FLIGHT MASS SPECTROMETER • Advantages • Comprehensive information on single particle composition • Disadvantages • May not ionise the entire particle • Illustrates the immense complexity of urban particles • Post-emission particles processing makes source recognition difficult • Some sources show immense diversity of composition when analysed as single particles
The ATOFMS (Aerosol Time-of-Flight Mass Spectrometer) • Laser based system. • Measures the size and composition • of individual particles. • Transportable. • Runs off 240VAC
Atmospheric Particles Particle Detectors measures the speed and hence the size of the individual particles. Dual Ion Mass Spectrometer measures the composition of the individual particles. ZAP! The ATOFMS (Aerosol Time-of-Flight Mass Spectrometer) 0.68m + ions - ions
SUMMARY AND CONCLUSIONS • Limited progress in source apportionment in the UK. • Receptor models based on major components. • Three component model now being superceded by eight component model. • Combination of receptor model and dispersion model more powerful. • Single particle mass spectrometry (ATOFMS) is powerful but poses series interpretational problems.