Download
1 / 28
280 likes | 433 Vues
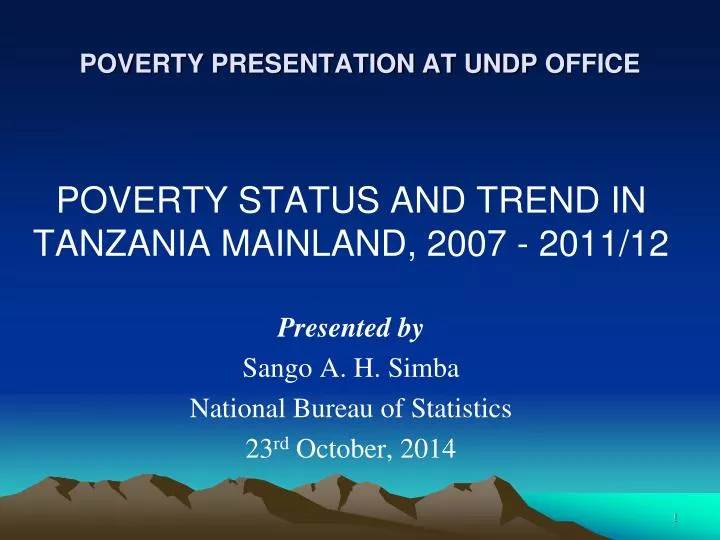
POVERTY PRESENTATION AT UNDP O FFICE. POVERTY STATUS AND TREND IN TANZANIA MAINLAND, 2007 - 2011/12. Presented by Sango A. H. Simba National Bureau of Statistics 23 rd October, 2014. SCOPE OF WORKSHOP. Part I: Diagnosis Introduction and background Part II: Findings

E N D
POVERTY PRESENTATION AT UNDP OFFICE POVERTY STATUS AND TREND IN TANZANIA MAINLAND, 2007 - 2011/12 Presented by Sango A. H. Simba National Bureau of Statistics 23rd October, 2014
SCOPE OF WORKSHOP Part I: Diagnosis Introduction and background Part II: Findings Poverty Assessment (The 2007 and 2011/12 HBS)
PART I DIAGNOSIS
Assessment of Poverty Indices by using Backward Methodology NBS has managed to use Backward Methodology to re-estimate poverty Indices of the 2007 HBS. These include: • Incidence of Poverty; • Distribution of Poor Population • Poverty Inequality and Depth;
I. Coverage of Presentation • The 2011/12 HBS is the Fourth Scientific Initiative done by the Government and Development partners to evaluate Poverty status in Tanzania Mainland • Evaluation Answers the Following Questions: • The recent poverty trend and profile • Where are Poor People • Poverty Inequality and depth • Poverty against Population Size • Poverty against Demographic Status
Estimated Poverty Lines Analysis covers DSM, Other Urban, Rural and Tanzania Mainland
PART II SURVEY FINDINGS
1: The Recent Poverty Trend and Profile • “Basic Need Poverty” declined by 6.2 percent since 2007. Reduced from 34.4 percent in 2007 to 28.2 in 20011/12; • “Extreme Poverty” declined from 11.8 percent in 2007 to 9.7 percent in 2011/12, a reduction of 2.1 percent; • “Incidence of Poverty” differ between rural and urban: more significant in Rural compared to urban (Dar es Salaam and Other Urban Areas); and • Broad consensus on the reduction of poverty at the Dar es Salaam and Rural compared to other urban Poverty has Decline since 2007
The Profile of Poverty • The proportions of the poor population ranged from 4.1 percent in Dar es Salaam to 33.3 percent in rural areas (a range of 29.2 percentage points) in 2011/12; and • In 2007 HBS, the lowest incidence was 14.1 in Dar es Salaam and the largest was 39.4 in rural areas (a range of 25.3 percentage point). Poverty decreased by 18 percent in Tanzania Mainland, 10 percent DSM, 6.2 percent in Rural areas and only a percent in Other Urban Areas
2: Where are the Poor Persons? The distribution of poor population (living below the basic needs poverty line) within Tanzania Mainland declined to 11,909,427 in 2011/12 from 13,175,509 poor persons in 2007: Geographically; • Less than two (1.5) percent founded in Dar es Salaam; • 14.4 percent live in Other Urban Areas; and • Over three quarters (more than 80 percent) live in rural areas.
Distribution of Poor Persons by Domain, 2007 and 2011/12 The absolute number of the Basic Needs poor people decreased significantly than food poverty between 2007 and 2011/12.
Percentage Distribution of Poor Persons by Domain, 2007 and 2011/12
3. Poverty Inequality and Depth “Gini coefficient” commonly known as Gini has been used to measure Inequality of distribution of per capita consumption expenditure: • The Gini takes the values between zero and one: A “zero”Gini value indicates perfect equality while a value of “1”indicates perfect inequality in the distribution; and • Mean and Median: Have also used to measure the details of inequality in monthly per consumption expenditure
Mean and Median Per Capita Consumption Expenditure and Gini Coefficient by Area, Tanzania Mainland; 2007 and 2011/12
Lorenz Curve for Monthly Household Consumption Expenditure for Tanzania Mainland, 2007 and 2011/12
Lorenz Curve for Monthly Household Consumption Expenditure by Area, Tanzania Mainland; 2007 and 2011/12
Poverty Depth The depth of poverty is measured by the Poverty Gap Index (PGI). It measures the depth of poverty being experienced by each household below the basic needs poverty line. • In 2007, the poor population were a little far below the Basic Needs Poverty line (10.3) as compared to 2001/12 (6.7); • The decline is also shown between all three domains (Table below).
Depth of Poverty by Area, Tanzania Mainland; 2007 – 2011/12 Due higher level Food Poverty, the rural areas generated a higher PGI of 11.8 percent in 2007 and 7.8 percent in 2011/12.
Other Non – income Indicators • Poverty declines strongly with education
Cont…. • Access to public infrastructure is linked to lower poverty
Cont… Wage employment is associated with lower levels of poverty
Cont…. Migrants are less poor
Conclusion • 12 million Tanzanians still lived below poverty line. Out of them, 10 million poor persons and 3.4 million extreme poor people live in rural areas; • The depth and severity of poverty (which measure how far the poor are from the poverty line) have also fallen and clustered around the line; • Inequality between Dar es Salaam and other areas is increasing though there was a decline of inequality in the country;
Cont….. • Poverty associated with larger families, lower education, low access to infrastructure. This is evidenced by Improvements in non-monetary dimensions of welfare; • Inequality partly explained by family background; and • Demographic pressures pose a challenge to poverty reduction in the country.

![Government of [Rwanda] UNDP-UNEP Poverty- Environment Initiative](https://cdn4.slideserve.com/749726/slide1-dt.jpg)