Download
1 / 4
40 likes | 55 Vues
New Jersey Middle School Survey. Summary Graphs. Number of students in a class of 30 who:. Sometimes, most of the time, or always wore a seatbelt when riding in a car. 26.2. Did not ever ride with a driver who had been drinking alcohol. 21.8. Did not ever carry a weapon. 23.0.

E N D
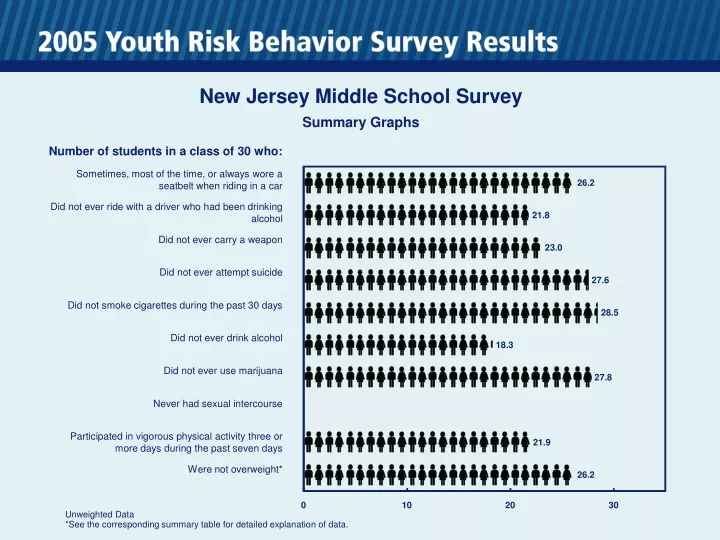
New Jersey Middle School Survey Summary Graphs Number of students in a class of 30 who: Sometimes, most of the time, or always wore a seatbelt when riding in a car 26.2 Did not ever ride with a driver who had been drinking alcohol 21.8 Did not ever carry a weapon 23.0 Did not ever attempt suicide 27.6 Did not smoke cigarettes during the past 30 days 28.5 Did not ever drink alcohol 18.3 Did not ever use marijuana 27.8 Never had sexual intercourse Participated in vigorous physical activity three or more days during the past seven days 21.9 Were not overweight* 26.2 0 10 20 30 Unweighted Data *See the corresponding summary table for detailed explanation of data.
New Jersey Middle School Survey Summary Graphs Number of students in a class of 30 who: Never or rarely wore a seatbelt when riding in a car 3.8 Ever rode with a driver who had been drinking alcohol 8.2 Ever carried a weapon 7.0 Ever attempted suicide 2.4 Smoked cigarettes during the past 30 days 1.5 Ever drank alcohol 11.7 Ever used marijuana 2.2 Ever had sexual intercourse Did not participate in vigorous physical activity three or more days during the past seven days 8.1 Were overweight* 3.8 0 10 20 30 Unweighted Data *See the corresponding summary table for detailed explanation of data.
New Jersey Middle School Survey Summary Graphs Percentage of students who: Sometimes, most of the time, or always wore a seatbelt when riding in a car 87.2 Did not ever ride with a driver who had been drinking alcohol 72.7 Did not ever carry a weapon 76.8 Did not ever attempt suicide 91.9 Did not smoke cigarettes during the past 30 days 94.9 Did not ever drink alcohol 61.0 Did not ever use marijuana 92.8 Never had sexual intercourse Participated in vigorous physical activity three or more days during the past seven days 73.0 Were not overweight* 87.2 0 20 40 60 80 100 Unweighted Data *See the corresponding summary table for detailed explanation of data.
New Jersey Middle School Survey Summary Graphs Percentage of students who: Never or rarely wore a seatbelt when riding in a car 12.8 Ever rode with a driver who had been drinking alcohol 27.3 Ever carried a weapon 23.2 Ever attempted suicide 8.1 Smoked cigarettes during the past 30 days 5.1 Ever drank alcohol 39.0 Ever used marijuana 7.2 Ever had sexual intercourse Did not participate in vigorous physical activity three or more days during the past seven days 27.0 Were overweight* 12.8 0 20 40 60 80 100 Unweighted Data *See the corresponding summary table for detailed explanation of data.