Download
1 / 12
150 likes | 307 Vues
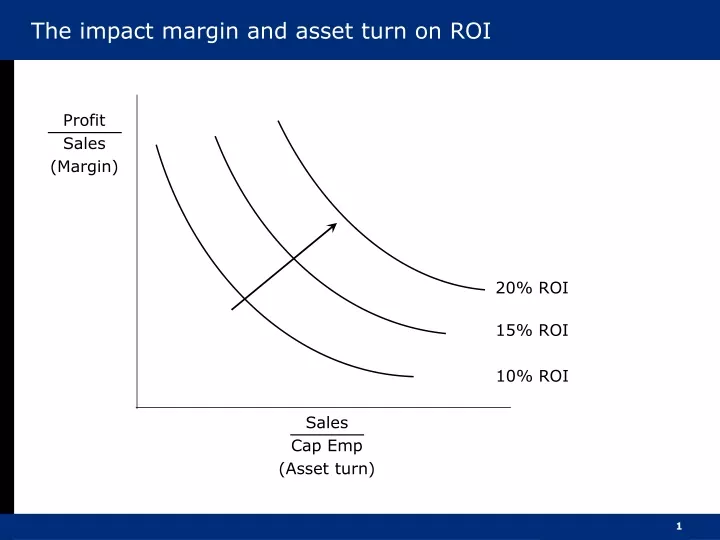
The impact margin and asset turn on ROI. Profit Sales (Margin). 20% ROI. 15% ROI. 10% ROI. Sales Cap Emp (Asset turn). Logistics impact on ROI. Sales revenue. Customer service. Profit. Costs. Logistics efficiency. Return on investment. Pipeline management. Cash.

E N D
The impact margin and asset turn on ROI Profit Sales (Margin) 20% ROI 15% ROI 10% ROI Sales Cap Emp (Asset turn)
Logistics impact on ROI Sales revenue Customer service Profit Costs Logistics efficiency Return on investment Pipeline management Cash Net receivables Invoice accuracy Capital employed Just-in-time logistics Inventory Fixed assets Asset deployment & utilisation
Logistics management and the balance sheet Balance sheet Logistics variable Assets Order cycle time Cash Order completion rate Receivables Invoice accuracy Inventory Inventories Distribution facilities and equipment Property, plant and equipment Plant and equipment Liabilities Current liabilities Purchase order quantities Debt Financing options for inventory, plant and equipment Equity
The drivers of shareholder value Revenue growth Tax minimisation Shareholder value Fixed capital efficiency Working capital efficiency Operating cost reduction
Changing the cash flow profile Cash flow Time Source: Srivastava, R. et al.,‘Market-Based Assets and Shareholder Value: A Framework for Analysis’, Journal of Marketing, Vol. 62, No. 1, January 1998, pp.2-18
Stages in the order-to-collection cycle Order placement and communication Order entry Credit check Documentation Order picking Delivery Invoicing and collection
The total costs of a distribution network Total distribution costs Costs Trunking costs Inventory costs Outlet costs Local delivery costs Order processing costs Number of outlets
Horizontal flows that cut across functional boundaries Purchasing Sales Transportation Production Marketing Etc Channel A Channel B Channel C
Customer profitability analysis Cumulative contributions (%) Cumulative customers (%) Source: Hill, G.V., Logistics – The Battleground of the 1990’s, A.T. Kearney., Inc.
Customer profitability analysis: a basic model Direct Gross sales value (GSV) Indirect Trade discount/ Terms of trade Net sales value (NSV) Customer related costs (direct) Production costs • Sales calls • In-store and co-operative promotions • Bonuses • Merchandising Production contribution (Sales) Marketing costs Overhead costs (indirect) • Sales force management • National advertising campaign Marketing contribution Customer-related costs (direct) Distribution Service costs • Transportation • Packaging/unitisation • Stockholding • Warehousing • Trade credit • Order processing Customer contribution to company overhead profit Source: Garttoma, J.L. and Walters, D.W., Managing the Supply Chain: A Strategic Perspective (PalgraveMacmillan, 1996), Reproduced with permission of PalgraveMacmillian
Customer profitability matrix Cost engineer Protect High Net sales value of customer account Danger Zone Build Low High Low Cost-to-serve