1 / 12

Intensity, Intensity Level, and Intensity Spectrum Level

meara
Télécharger la présentation

Intensity, Intensity Level, and Intensity Spectrum Level

An Image/Link below is provided (as is) to download presentation Download Policy: Content on the Website is provided to you AS IS for your information and personal use and may not be sold / licensed / shared on other websites without getting consent from its author. Content is provided to you AS IS for your information and personal use only. Download presentation by click this link. While downloading, if for some reason you are not able to download a presentation, the publisher may have deleted the file from their server. During download, if you can't get a presentation, the file might be deleted by the publisher.

E N D

Presentation Transcript


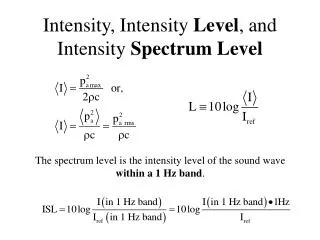
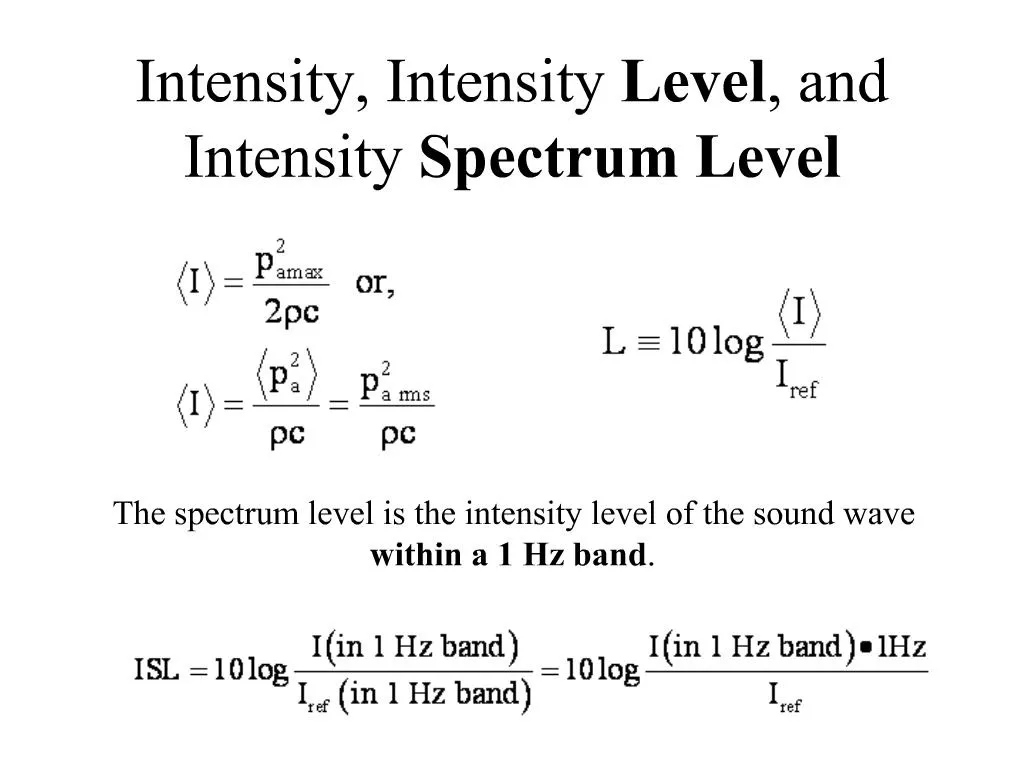
    1. Intensity, Intensity Level, and Intensity Spectrum Level

    2. A Sonar System

    3. System Output Fourier Transform of the Time Domain Signal Frequency Analyzer

    4. Example

    5. Fourier Coefficients

    6. Band Level

    7. Example Using the plot of ISL as a function of frequency shown, calculate the band level of every band the total band level the total band level in a band from 150 Hz to 300 Hz

    8. Types of Spectrums

    9. Example

    10. Common Bandwidths Constant Bandwidth Df = constant Proportional Bandwidth Octave Bandwidth f2 = 21 f1 Half Octave Bandwidth f2 = 21/2 f1 Center Frequency

    11. Preferred Octave Bands

    12. Why do we care? Source Level (SL) and Noise Level (NL) are both examples of Band Levels (BL) where the frequency band(s) are defined by the frequencies of our Sonar System

More Related