Download
1 / 1
10 likes | 154 Vues
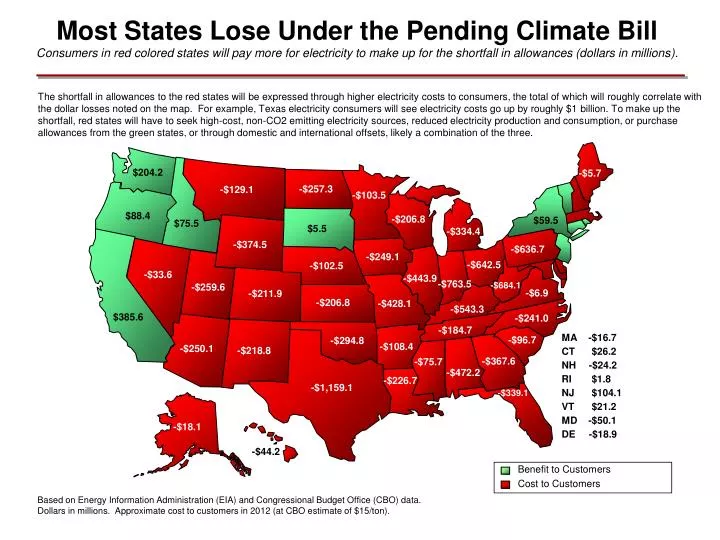
Benefit to Customers Cost to Customers. Most States Lose Under the Pending Climate Bill Consumers in red colored states will pay more for electricity to make up for the shortfall in allowances (dollars in millions).

E N D
Benefit to Customers Cost to Customers Most States Lose Under the Pending Climate BillConsumers in red colored states will pay more for electricity to make up for the shortfall in allowances (dollars in millions). The shortfall in allowances to the red states will be expressed through higher electricity costs to consumers, the total of which will roughly correlate with the dollar losses noted on the map. For example, Texas electricity consumers will see electricity costs go up by roughly $1 billion. To make up the shortfall, red states will have to seek high-cost, non-CO2 emitting electricity sources, reduced electricity production and consumption, or purchase allowances from the green states, or through domestic and international offsets, likely a combination of the three. $204.2 -$5.7 -$257.3 -$129.1 -$103.5 $88.4 -$206.8 $59.5 $75.5 $5.5 -$334.4 -$374.5 -$636.7 -$249.1 -$642.5 -$102.5 -$33.6 -$443.9 -$763.5 -$684.1 -$259.6 -$6.9 -$211.9 -$206.8 -$428.1 -$543.3 $385.6 -$241.0 -$184.7 MA -$16.7 CT $26.2 NH -$24.2 RI $1.8 NJ $104.1 VT $21.2 MD -$50.1 DE -$18.9 -$96.7 -$294.8 -$108.4 -$250.1 -$218.8 -$367.6 -$75.7 -$472.2 -$226.7 -$1,159.1 -$339.1 -$18.1 -$44.2 Based on Energy Information Administration (EIA) and Congressional Budget Office (CBO) data. Dollars in millions. Approximate cost to customers in 2012 (at CBO estimate of $15/ton).