Download
1 / 14
260 likes | 676 Vues
Local Structure around In Atoms in In x Ga 1- x N Single-Quantum-Well by XAFS T. Miyanaga Department of Materials Science and Technology, Faculty of Science and Technology, Hirosaki University, Hirosaki, Aomori 036-8561, Japan. InGaN LED. Band gap and In concentration x.

E N D
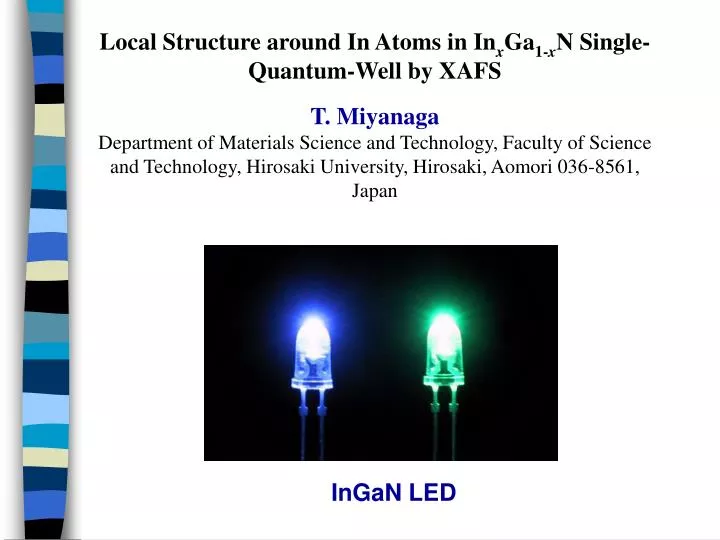
Local Structure around In Atoms in InxGa1-xN Single-Quantum-Well by XAFST. MiyanagaDepartment of Materials Science and Technology, Faculty of Science and Technology, Hirosaki University, Hirosaki, Aomori 036-8561, Japan InGaN LED
Band gap and In concentration x Chichibu, S.F., Sota, T., Wada, K., Brandt, O., Ploog, K.H., DenBaars, S.P., and Nakamura, S., Phys. Stat. Sol.(a), 183, 91 (2001).
Purpose of the study • InGaN SQW shows high quantum efficiency, although it has very high densities of threading dislocations. • In mole fluctuation in InGaN active layers is proposed as its origin. • To make the emission mechanism clear in InGaN LED, it is important to clarify local structures around In atoms. • Fluorescence EXAFS is applied to study the InGaN SQW.
ExperimentalSamples:The sample was grown by MOCVD3nm SQWInxGa1-xN (x = 0.145 blue,0.20 green,0.275 amber) SSD Sample X-ray Structure of InGaN SQW (3nm)
X-ray absorbing measurements SPring-8: BL01B1, BL38B1, BL10XU-In K-edge (27.9keV)-Si (111) Monochromator-Fluorescence EXAFS-19-SSD(Ge)(3nm SQW, Cap layers) SSD Sample X-ray Rotated
EXAFS kc(k) spectra and Fourier transform of In K-edge for In0.20Ga0.80N SQW in horizontal and vertical directions. In-N In-Ga/In
wurtzite structure(GaN, InN) Assumption: InGaN SQW is wurtzite ●In ●N ●Ga or In
Theoretical fitting for In K-edge for In0.20Ga0.80N SQW in horizontal direction for 1st and 2nd peaks.
In-Ga In-In x h/v r / A N* s / A r / A N* s / A 0.145 h 3.23 10.2 0.066 3.23 1.8 0.041 v 3.25 9.3 0.080 3.32 2.7 0.099 0.20 h 3.22 9.7 0.077 3.24 2.3 0.067 v 3.26 7.7 0.064 3.28 4.3 0.083 0.275 h 3.23 9.1 0.071 3.25 2.9 0.082 v 3.26 8.7 0.075 3.30 3.3 0.081 Structural parameters obtained from EXAFS analyses for second peak in FT.*Sum of N for In-Ga and In-In is fixed to 12
Result 1Interatomic distance(1)In-N: Horizontal ~Vertical (2.10A)(2)In-Ga/In: Vertical (3.28-30A) > Horizontal (3.24-25A) SQW is biaxially compressed in a-b plane
The ratio of coordination numbery = NIn-In / (NIn-In + NIn-Ga)from EXAFSx : average concentration of In
Result 2(1)Horizontal: In atoms are randomly distributed(2)Vertical: In atoms are aggregated and located top and bottom In mole fluctuation !
Co-authorsT. Azuhata, S. Matsuda, Y. Ishikawa (Hirosaki University, Japan)T. Uruga, H. Tanida (SPring-8, JASRI, Japan)SF. Chichibu (University of Tsukuba, Japan)T. Sota (Waseda University, Japan)T. Mukai (Nichia Corporation, Japan) Conclusion EXAFS result is evidence of composition fluctuation of In atom in the SQW and should closely related to the high quantum efficiency of InGaN LED