Download
1 / 15
150 likes | 277 Vues
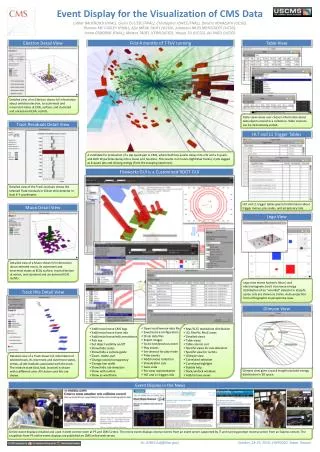
Tracker data quality monitoring based on event display. M.S. Mennea – G. Zito University & INFN Bari - Italy. Tracker Map. We have developed in IGUANACMS a specialized 2D representation of tracker, a kind of scatter plot where all modules are represented in a single screen.

E N D
Tracker data quality monitoring based on event display M.S. Mennea – G. Zito University & INFN Bari - Italy
Tracker Map We have developed in IGUANACMS a specialized 2D representation of tracker, a kind of scatter plot where all modules are represented in a single screen • This representation is not static but it is an interactive image where you can • zoom and get more detail up to the level of micro-strip, - pick a zone and get more information on that zone, • etc… 1
Possible use of tracker map (1) For monitoring in the control room • A screen runs all the time with this image constantly updated. This will allow a fast overall visual check and an additional cross-check of “normal” automatic monitoring procedures that send alarms in case of problem • - The interactive features can be useful when the operator has alarms and must diagnose the problem. He clicks on the problem zone on the map getting more information • - This representation is a kind of high level user interface for tracker monitoring data visualization 2
Possible use of tracker map (2) To reach experts outside the control room • The tracker map can summarize the information content of hundreds of events or thousands of histograms and as such, it is the quickest way to inform experts everywhere in the world about the tracker situation • This can be done with • a Java program • i.e. the computer where the expert sits, has no CMS software running on it, but only a Java program • 2) sending a SVG image with interactive features implemented in Javascript 3
Possible use of tracker map (3) • Monitoring in a specialized Tier2 centre and sending a fast feedbackin the control room • - In the control room we have access to all raw data, but the computing resources may be scarce. • So why not to ship a sizeable amount of tracker raw data to a specialized Tier2 center. • At least 10% through an high bandwidth connection • This center can analyze the data as they arrive, doing a quasi-online monitoring and sending back to the control room the result of this analysis summarized as a tracker map. 4
How to access tracker data relevant for monitoring (1) In order to have a high level user interface to monitoring data working like this map, fast and standard access to all data relevant to tracker monitoring is essential. fast because the map needs a lot of data standard since we don't want to use a different API for each data source. And we have many possible data sources: • Online raw data • Raw data stored on dataset on the Grid • The construction database • The conditions database • The histogram database • Other ... 5
How to access tracker data relevant for monitoring (2) A possible solution is using Web Services • This means: • we must have a data server for each data source • each monitoring data chunk must have a unique URL 6
What to represent with tracker map Some possible examples • Display event in tracker • Display last few events accumulated • Display temperatures,voltages and other data from • conditions database • Display dead strips and other data from construction • database • Display result of global check of tracker by comparing • last module histogram with reference histogram for • each module 7
Present Status (1) • We have now in IGUANACMSa “CustomTracker” part with three main features that can be useful for tracker monitoring: 1. Numbering of each tracker module, clicking on it you can know its position. 2. Easy way to select each detector part down to the module level. Stereo pair modules can be selected separately. 8
Present Status (2) 3.A first implementation of the tracker map. This map represents all 17000 tracker modules with the following schema: 1 2 1 2 3 1 2 3 4 5 6 7 8 9 +z 3 2 4 2 4 6 PXB 1 TIB TOB 3 2 1 1 3 5 PXE -z TEC TID 2 1 2 3 5 8 1 2 1 3 4 6 7 9 This map cannot be zoomed, but you can go to the level of the single channel selecting a single layer 9
Present Status (3) We have built a prototype (Java program named Tmon) that implements the same tracker map that we have in IGUANACMS We tested it with data taken from construction database and from Montecarlo events dataset. 10
Present Status (4): Results of the test with a prototype We can read and display the data in the tracker in around 10 seconds. The same time is needed to load xml tracker description. Examples of response time with events of different size 11
Present Status (5): Sending an interactive image in SVG + Javascript We are also testing another interesting variation of the previous scenario. Instead of sending the information to the expert as data for a Java program, we can send directly the tracker map in SVG format with the interactive features implemented in Javascript. Here again the results are promising: in around a minute you can get the image using a normal browser with the Adobe SVG plugin. We are now working on the best way to update the image with new data. 12
Present Status (6): Sending an interactive image in SVG + Javascript You can zoom 13
Requirements for online monitoring software • A viewer for collections of data up to the level of a sub-detector should be provided • The viewer should run al the time for a fast overall check of sub-detector operations • The same viewer should be also implemented in a version that gets the data from a normal internet connection • The access to data relevant for monitoring must be interactive and the same for all data sources 14