Download
1 / 15
150 likes | 300 Vues
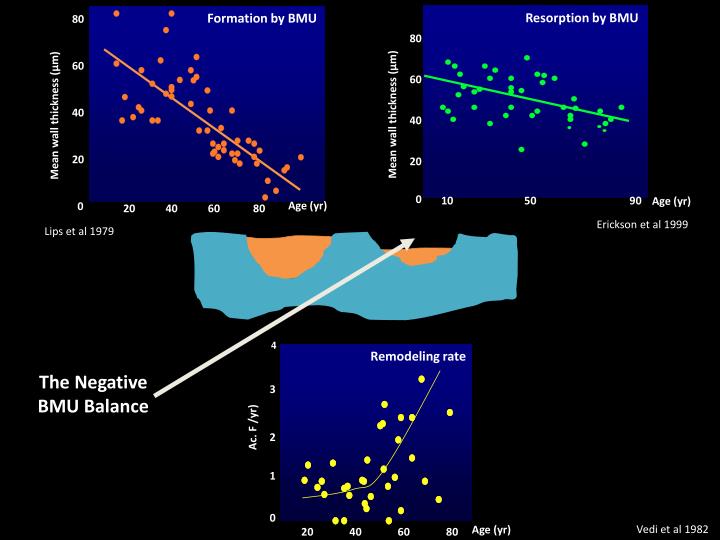
80. 60. 40. 20. Resorption by BMU. Formation by BMU. 80 60 40 20 0. Mean wall thickness (µm). Mean wall thickness (µm). Age (yr). 0. 10. 50. 90. Age (yr). 20 40 60 80. Erickson et al 1999. Lips et al 1979. 4. Remodeling rate.

E N D
80 60 40 20 Resorption by BMU Formation by BMU 80 60 40 20 0 Mean wall thickness (µm) Mean wall thickness (µm) Age (yr) 0 10 50 90 Age (yr) 20 40 60 80 Erickson et al 1999 Lips et al 1979 4 Remodeling rate The Negative BMU Balance Women 3 Ac. F /yr) 2 1 0 Vedi et al 1982 Age (yr) 20 40 60 80
Perimeter available for remodeling (m) 2.5 2 Cort 1.5 1 Trab 0.5 0 0 <50 60-79 80 + mgHA/yr Age (yrs) 5 Amount of bone lost from the cortical and trabecular compartments 4 Cort 3 2 Trab 90% 45% 55% 1 10% 0 50-64 65-79 80+ Zebaze et al 2010
The Four Envelopes of Bone Periosteal Intracortical Endocortical Trabecular
Restored, Slower Steady State Perturbed Higher density of a decreasing Bone Volume BMD Untreated Treat Structural decay
Trabecular Bone High Surface/Volume Configuration 100 nmol/g Accessible to remodeling and treatment C14Zoledronic Acid Distribution 75 Vertebrae 50 Tibia DRUG 25 Skull 0 --16 16 48 80 112 144 176 208 240 days Weiss et al Drug MetabDistribut 2006;36:2043
Cortical Bone Low Surface/Volume Endocortical surface Less Access
Bone 49 (2011) 128–132 BP on bone surfaces 0 -20 -40 -60 -80 High Affinity ALN 2.4 L4 trabec BFR % control Low affinity RISED 1.2 1-2 2-3 3-4 Weeks Mararachia et al Bone 1996;19:281 Allen et al Bone 2011;49:128
Penetration into Bone Matrix High Affinity Compound Low Affinity Compound Turek et al Calcif Tissue Int 2012;90:202
Mice constitutively activated PTH/PTHrP receptor have high porosity 1350 1250 1150 \ 1050 Cortical porosity (%) Cortical vBMD (mg/cm2) 6 4 2 0 OPG Vehicle ALN ZOL ZOL Vehicle ALN *** OPG 0 2 4 6 8 Cortical porosity (%) Femur energy to failure (Nmm) 8 6 4 2 0 OPG** Toughness (MPa) 15 10 5 0 OPG** **relative to vehicle ALN ALN ZOL ZOL Vehicle Vehicle 0 2 4 6 8 0 2 4 6 8 Cortical porosity (%) Cortical porosity (%) Ohishi et al Am J Pathol 2009;174:2160
AntiresorptiveTherapies and the Surface Extent of Remodeling Reflected in the Mineralizing Surface MS/BS (%) 10 Normal 10 L-235 BFR/BS Vertebral Cancellous Bone, rabbits % Odanacatib 120 100 80 60 40 20 0 % 8 Ovx+L-235 2 mg/kg 10 mg/kg 8 Ovx 6 6 Ovx+ALN *Sham 4 4 Ris Ibn Zol Aln DMab 2 2 0 3 10 25 50 mg Placebo 0 Pennypacker et al JBMR 2011 Bone H et al JBMR 2010 Recker JBMR 1988;31:133 Eriksen Bone 2002;31:620 Chavassieux JCI 1997;100:1475 Recker OI 2004;15:231 Recker JBMR 1008;23:6 Reid JBMR 2010
BP = fewer, same depth? Steady State Perturbed Restored, same number, more shallow Steady state remodeling restored. Whether there is bone loss, no loss or gain depends on bone balance. BMD Untreated Treat Structural decay
Prox Femur Endocort Surface 20 16 12 8 4 0 Prox Femur Trab Bone Haversian Canal Surface Fem. Neck Trab Bone 6 4 2 0 75 50 25 0 25 20 15 10 5 0 p=0.05 MS/BS (%) p<0.001 p<0.01 p<0.005 0.8 0.4 0 1.0 0.8 0.6 0.4 0.2 0 1.2 0.6 0 1.5 1.0 0.5 0 p<0.05 MAR (µm/d) 60 30 0 100 60 20 0 16 8 0 100 50 0 p<0.05 BFR (µm3/µm3/yr) p=0.05 p<0.001 p<0.005 p<0.01 Veh 6 30 mg/kg Veh 6 30 mg/kg Veh 6 30 mg/kg Veh 6 30 mg/kg p values refer to difference relative to vehicle
30 20 10 0 Periosteal Surface Proximal Femur Femoral Neck 50 25 0 Vehicle MS/BS (%) 0.8 0.4 0 0.3 0.2 0.1 0 p<0.05 MAR (µm/d) OD 30 mg/kg 30 20 10 0 120 60 0 p<0.01 p<0.05 BFR (µm3/µm3/yr) p values refer to difference relative to vehicle
Ronacalerat– Ca Receptor Antagonist LSaBMD Total Hip aBMD % Change TERI 12 TERI 6 ALN 10 ALN PBO 4 8 RONA 2 % Change 6 RONA PBO 4 0 2 -2 0 200 -4 --2 160 BL M6 M12 BL M6 M12 RONA 120 Intact PTH (mg/L) 80 ALN 40 PBO 0 0 1 2 3 4 5 6 7 8 Time (h) Fitzpatrick et al JBMR 2011