Download
1 / 15
150 likes | 308 Vues
SITUATION OF THE CANOLA INDUSTRY IN MEXICO. March 22nd 2004. CONTENTS. HISTORY OF CANOLA PRESENCE IN MEXICO. MILLING AND REFINING CAPACITY IN MEXICO. LOCATION OF MEXICO’S OIL INDUSTRY. NATIONAL PRODUCTION OF OIL SEEDS IN MEXICO, 1980 - 2003.

E N D
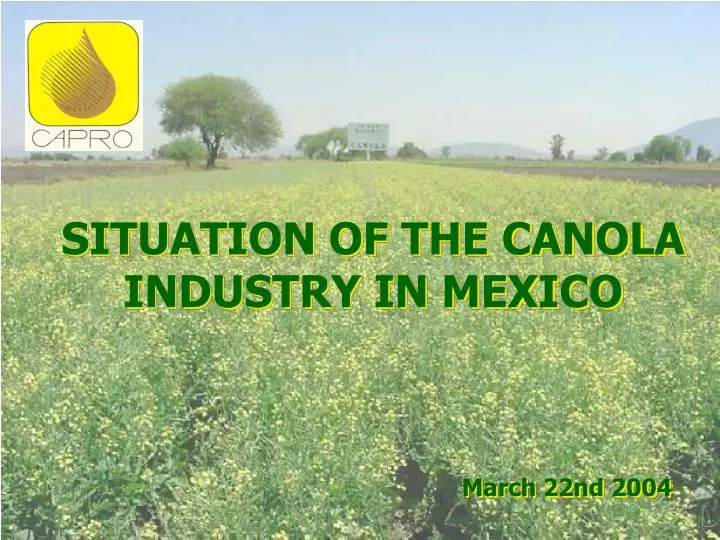
SITUATION OF THE CANOLA INDUSTRY IN MEXICO March 22nd 2004
CONTENTS HISTORY OF CANOLA PRESENCE IN MEXICO MILLING AND REFINING CAPACITY IN MEXICO LOCATION OF MEXICO’S OIL INDUSTRY NATIONAL PRODUCTION OF OIL SEEDS IN MEXICO, 1980 - 2003 DOMESTIC PROD. AND IMPORTS OF SEEDS, OILS AND FATS, CYCLE 2002 CANOLA IMPORTS, 1995 - 2002 HISTORIC BEHAVIOR OF EDIBLE OILS AND FATS IN MEXICO, 1996 - 2002 FINAL USES OF DIFFERENT EDIBLE VEGETABLE OILS DISTRIBUTION OF CONSUMPTION OF OILS AND FATS, CYCLE 2002 EVOLUTION OF CONSUMPTION OF OILS, FATS AND PROTEINS, 1991 - 2002
HISTORY OF CANOLA IN MEXICO • In the year 1985, oil companies in Mexico began to work with the canola seed. The first were Exportadora Jalisco and Industrias Ragasa, each importing one vessel during that year. • The third company was Aceitera la Junta in the year 1986, and later other companies, such as Aceites, Grasas y Derivados, Industrial Aceitera, Fábrica de Jabón la Corona, etc. followed suit. • In the year 1988, rapeseed was imported from Australia, Poland, Denmark, England, Germany and France. • In the year 2001, two vessels were imported from France, two from germany and two from Poland. Inicio Siguiente
PERCENTAGE OVER INSTALLED MILLING AND REFINING CAPACITY BY FEDERAL ENTITY IN TONS PER MONTH Enero 31,2002 Federal entity No. companies Tons/mo Milling % Monthly Milling Tons/mo Refining % Monthly refining 2,400 7,800 - - 63,600 83,000 12,000 5,700 14,000 3,300 - 10,500 - 20,000 4,000 1.06 3.45 - - 28.10 36.68 5.30 2.52 6.18 1.46 - 4.64 - 8.84 1.77 1 5 1 1 16 5 2 5 2 2 3 5 3 1 3 - 7,500 30,000 30,000 198,000 47,000 4,500 51,000 45,000 27,000 23,400 48,000 40,500 55,000 60,000 - 1.12 4.50 4.50 29.69 7.05 0.67 7.64 6.75 4.05 3.51 7.20 6.07 8.25 9.00 Coahuila D.F. Durango Guanajuato Jalisco ** México Michoacán Nuevo León Hidalgo Puebla Sinaloa Sonora Tamaulipas Veracruz Yucatán TOTAL 55 666,900 100.00 226,300 100.00 ANNUAL 8,002,800 2,715,600 ** Extension that will be finalized in the second semester of this year MILLING AND REFINING CAPACITY IN MEXICO Inicio Siguiente
LOCATION OF MEXICO’S OIL INDUSTRYL Inicio Siguiente
DOMESTIC OILSEED PRODUCTION IN MEXICO 1980-2003 ( 2) TOTAL Thousands of tons Inicio Siguiente
DOMESTIC PRODUCTION AND IMPORTS OF SEEDS, OILS AND FATS, CYCLE 2002 DOMESTIC PRODUCTION THOUSANDS OF TONS IMPORTS THOUSANDS OF TONS DOMESTIC PROD. PLUS IMPORTS IN THOUSANDS OF TONS SEEDS OILS AND FATS MEALS SEEDS OILS AND FATS MEALS SEEDS OILS AND FATS MEALS SUBTOTAL OUTPUT OILS AND FATS SUBTOTAL MEAL, FLOUR AND BRAN SUBTOTAL T O T A L 484.6 0 0 484.6 170.7 125.2 0 295.9 240.8 23.4 0 264.2 5,398.8 0 0 5,398.8 1,125.7 1,236.6 0 2,362.3 3,902.6 0 1,031.1 4933.7 5,883.4 0 0 5,883.4 1,296.4 1,361.8 0 2,658.2 4,166.7 0 1,031.1 5,197.8 FOREIGN DEPENDENCE IN SEEDS = 92% OILS AND FATS = 89% MEALS = 95% Inicio Siguiente
CANOLA IMPORTS, 1995 - 2003 Canola s imports in the last nine years: Inicio Siguiente
BEHAVIOR OF EDIBLE OILS AND FATS IN MEXICO, 1996 - 2002 Thousands of Tons CONTINUA... Inicio Siguiente
BEHAVIOR OF EDIBLE OILS AND FATS IN MEXICO, 1996 – 2002 (2) Thousands of Tons Inicio Siguiente
FINAL UTILIZATION OF DIFFERENT EDIBLE VEGETABLE OILS, CYCLE 2002 Thousands of Tons Inicio Siguiente
CONSUMPTION DISTRIBUTION OF OILS AND FATS, CYCLE 2002 Miles de Toneladas Siguiente Inicio
EVOLUTION IN OIL, FAT AND PROTEIN CONSUMPTION 1991 – 2002 Thousands of Tons OVER... Inicio Siguiente
EVOLUTION IN OIL, FAT AND PROTEIN CONSUMPTION 1991 – 2002 (2) Thousands of Tons Inicio Siguiente