Download
1 / 14
140 likes | 238 Vues
Comprehensive Capital Market Solutions For Commercial Real Estate. NC CCIM – 2013 Commercial Real Estate Forecast. Others 10%. Others 5%. Finance Companies 2%. State & Local Gov 2%. Commercial Banking 34%. Commercial Banking 33%. State & Local Gov 7%. Life Insurance Cos 14%.

E N D
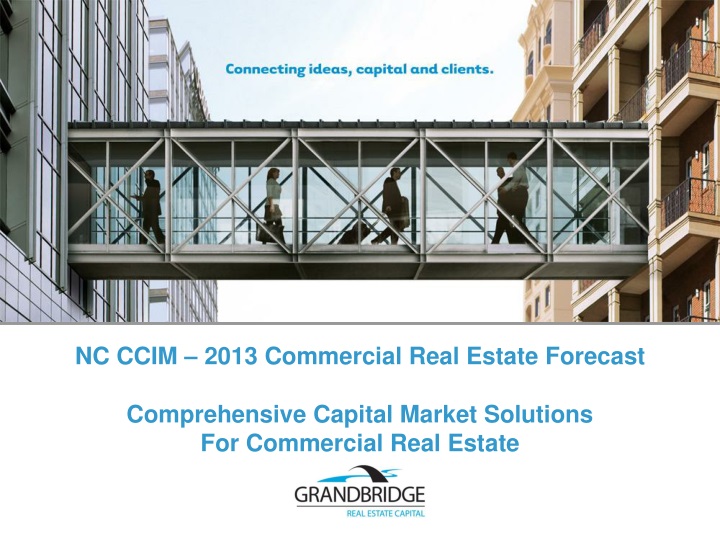
Comprehensive Capital Market SolutionsFor Commercial Real Estate NC CCIM – 2013 Commercial Real Estate Forecast
Others 10% Others 5% Finance Companies 2% State & Local Gov 2% Commercial Banking 34% Commercial Banking 33% State & Local Gov 7% Life Insurance Cos 14% CMBS, CDO, and other ABS Issues 24% Life Insurance Cos 13% CMBS, CDO, and other ABS Issues 26% Agency and GSEs 16% Agency and GSEs 14% Commercial / Multifamily Debt Outstanding ComparisonBy Investor Group $2.38 Trillion, Q3 2012 $2.37 Trillion, Q3 2011 Source: Commercial Quarterly Data Book – 3rd Q 2011 Mortgage Bankers Association
Commercial and Multifamily Mortgage Flows Net Change in Commercial and Multifamily Mortgage Debt Outstanding, by Sector (in Millions) Source: Commercial Quarterly Data Book – 3rd Q 2011 Mortgage Bankers Association
Commercial and Multifamily Mortgage Loan Originations • Compared to Q3 2011…… • Q3 2012 origination volumes 7% lower. • Borrowing slowed in Q3 despite low interest rates due to moderate pace of commercial transactions (retail and office) and a continued drop in loan maturities. Property types that increased were hotels (4%), industrial and healthcare (19%), multifamily (30%). • Among investors, life company loans decreased by 32%, 8% increase for commercial banks, 30% increase for GSEs, no change in volume for CMBS. Source: Commercial Quarterly Data Book – 3rd Q 2011 Mortgage Bankers Association
Outstanding U.S. CRE Debt Total Commercial and Multifamily = [$2.42 Trillion] • Insurance companies = [$338 Billion (14%)] • GSEs = [$369 Billion (15.25%)] • CMBS = [$579 Billion (24%)] • Banks/Thrifts = [$811 Billion (33.50%)] • Other = [$319 Billion (13.25%)]
Quarterly Originations Source: Commercial Quarterly Data Book – 3rd Q 2011 Mortgage Bankers Association
Quarterly Issuance of CMBS Billions of Dollars
Commercial and Multifamily Mortgage Loan Market Share • $2.38 trillion in outstanding commercial/multifamily mortgage debt in Q3 2012, $6.6 billion higher than Q2 2012, as three of the four major investor groups increased their holdings. • Fannie, Freddie, FHA, life insurance companies, and banks all increased their holdings and/or guarantees of commercial and multifamily mortgages, outpacing a decline in the balance of commercial and multifamily mortgages held in commercial mortgage backed securities. Source: Commercial Quarterly Data Book – 3rd Q 2011 Mortgage Bankers Association
Delinquency Rates • DQ rates decreased for commercial and multifamily mortgage loans in Q3 • DQ rates on bank-held loans is at lowest level since beginning of 2009 • DQ rates for CMBS continues to stabilize. • Based on UPB by Investor Group at end of Q3 2012 • Life Companies 0.12% (60+ days) (0.19% in 2011) • Freddie Mac 0.27% (60+ days) (0.33% in 2011) • Fannie Mae 0.28% (60+ days) (0.57% in 2011) • Banks 2.93% (90+ days) (3.76% in 2011) • CMBS 8.86% (30+ & REO) (8.92% in 2011) Source: Commercial Quarterly Data Book – 3rd Q 2011 Mortgage Bankers Association
2012 What Was Hot Multifamily – 80% LTV, 4% rate Grocery-Anchored Retail – 75%, 4.25% Office – 70%, rollover, TIs Industrial – 70%, 20 year amort 2013 What’s Hot Multifamily – 85%, 3.50% Grocery-Anchored Retail – 75%, 4% Office / MOB – 75%, rollover, focus on TIs Industrial – 75%, rollover Hospitality – 70%, 10.75% DY, 235bps over Self-Storage – 75% Credit Retail – fully amortizing to lease term CMBS – 75%, A-B Structures down to 1.10x 2012 What Wasn’t Unanchored Retail – 60%, rollover Hospitality/Lodging – go away Self-Storage – 65% @ 9% caps 2012 What’s Not Unanchored Retail – 65%, historical tenancy
Historical10 Year Treasury Yield Curve, 1962 – 2013 July 1981 15.84% 1.38% July 2013
10 Year Treasury Yield Curve, March 2011 to March 2012 2.27% 3.54% 1.71% 10 Year Treasury Yield Curve, March 2012 to March 2013 2.03% -99bps 2.37% 1.38%
Grandbridge Real Estate Capital – Raleigh Office 700 Spring Forest Rd, Suite 325 Raleigh, NC 27609 Bob Hukill, Senior Vice President bhukill@gbrecap.com | 919.871.6300 Velinda Dismukes, Assistant Vice President vdismukes@gbrecap.com | 919.871.6300 Wesley Fricks, Analyst wfricks@gbrecap.com | 919.871.6300