Download
1 / 1
10 likes | 107 Vues
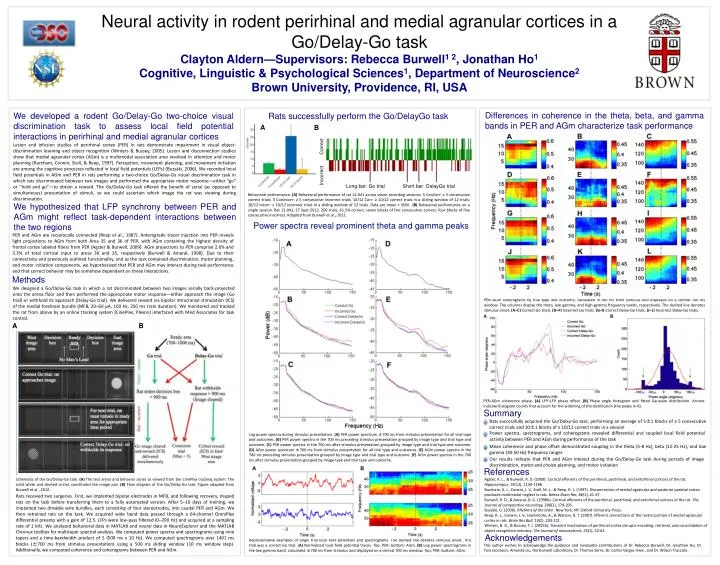
Neural activity in rodent perirhinal and medial agranular cortices in a Go/Delay-Go task Clayton Aldern—Supervisors: Rebecca Burwell 1 2 , Jonathan Ho 1 Cognitive, Linguistic & Psychological Sciences 1 , Department of Neuroscience 2 Brown University, Providence, RI, USA.

E N D
Neural activity in rodent perirhinal and medial agranular cortices in a Go/Delay-Go task Clayton Aldern—Supervisors: Rebecca Burwell1 2, Jonathan Ho1 Cognitive, Linguistic & Psychological Sciences1, Department of Neuroscience2 Brown University, Providence, RI, USA Differences in coherence in the theta, beta, and gamma bands in PER and AGm characterize task performance We developed a rodent Go/Delay-Go two-choice visual discrimination task to assess local field potential interactions in perirhinal and medial agranular cortices Rats successfully perform the Go/DelayGo task A B Lesion and infusion studies of perirhinal cortex (PER) in rats demonstrate impairment in visual object-discrimination learning and object recognition (Winters & Bussey, 2005). Lesion and disconnection studies show that medial agranular cortex (AGm) is a multimodal association area involved in attention and motor planning (Burcham, Corwin, Stoll, & Reep, 1997). Perception, movement planning, and movement initiation are among the cognitive processes reflected in local field potentials (LFPs) (Buzsàki, 2006). We recorded local field potentials in AGm and PER in rats performing a two-choice Go/Delay-Go visual discrimination task in which rats discriminated between two images and performed the appropriate motor response—either “go” or “hold and go”—to obtain a reward. The Go/Delay-Go task offered the benefit of serial (as opposed to simultaneous) presentation of stimuli, so we could ascertain which image the rat was viewing during discrimination. Incorrect Correct Long bar: Go trial Short bar: DelayGo trial Behavioral performance. (A)Behavioral performance of rat 12-041 across seven recording sessions. 5 ConCorr: ≥ 5 consecutive correct trials; 5 ConIncorr: ≥ 5 consecutive incorrect trials; 10/12 Corr: ≥ 10/12 correct trials in a sliding window of 12 trials; 10/12 Incorr: ≥ 10/12 incorrect trials in a sliding window of 12 trials. Data are mean + SEM. (B) Behavioral performance on a single session. Rat 12-041, 27 Sept 2012. 200 trials, 61.5% correct, seven blocks of five consecutive correct, four blocks of five consecutive incorrect. Adapted from Burwell et al., 2012. We hypothesized that LFP synchrony between PER and AGm might reflect task-dependent interactions between the two regions Power spectra reveal prominent theta and gamma peaks PER and AGm are reciprocally connected (Reepet al., 1987). Anterograde tracer injection into PER reveals light projections to AGm from both Area 35 and 36 of PER, with AGm containing the highest density of frontal cortex labeled fibers from PER (Agster & Burwell, 2009). AGm projections to PER comprise 2.6% and 3.3% of total cortical input to areas 36 and 35, respectively (Burwell & Amaral, 1998). Due to their connectivity and previously outlined functionality, and as the task contained discrimination, motor planning, and motor initiation components, we hypothesized that PER and AGm may interact during task performance and that correct behavior may be somehow dependent on these interactions. Methods We designed a Go/Delay-Go task in which a rat discriminated between two images serially back-projected onto the arena floor and then performed the appropriate motor response—either approach the image (Go trial) or withhold its approach (Delay-Go trial). We delivered reward via bipolar intracranial stimulation (ICS) of the medial forebrain bundle (MFB, 20–60 µA, 100 Hz, 250 ms train duration). We monitored and tracked the rat from above by an online tracking system (CinePlex, Plexon) interfaced with Med Associates for task control. PER–AGm coherograms by trial type and outcome, calculated ±700 ms from stimulus and displayed on a central 700 ms window. The columns display the theta, low gamma, and high gamma frequency bands, respectively. The dashed line denotes stimulus onset. (A–C) Correct Go trials. (D–F) Incorrect Go trials. (G–I) Correct Delay-Go trials. (J–L) Incorrect Delay-Go trials. A B PER-AGm coherence phase. (A) LFP–LFP phase offset. (B) Phase angle histogram and fitted Gaussian distribution. Arrows indicate histogram counts that account for the widening of the distribution (the peaks in A). Summary Rats successfully acquired the Go/Delay-Go task, performing an average of 5±1 blocks of ≥ 5 consecutive correct trials and 10±1 blocks of ≥ 10/12 correct trials in a session Power spectra, spectrograms, and coherograms revealed differential and coupled local field potential activity between PER and AGm during performance of the task Log power spectra during stimulus presentation. (A) PER power spectrum ±700 ms from stimulus presentation for all trial type and outcomes. (B) PER power spectra in the 700 ms preceding stimulus presentation grouped by image type and trial type and outcome. (C) PER power spectra in the 700 ms after stimulus presentation grouped by image type and trial type and outcome. (D) AGm power spectrum ±700 ms from stimulus presentation for all trial type and outcomes. (E) AGm power spectra in the 700 ms preceding stimulus presentation grouped by image type and trial type and outcome. (F) AGm power spectra in the 700 ms after stimulus presentation grouped by image type and trial type and outcome. Mean coherence and phase offset demonstrated coupling in the theta (5-8 Hz), beta (12-25 Hz), and low gamma (30-50 Hz) frequency ranges Our results indicate that PER and AGm interact during the Go/Delay-Go task during periods of image discrimination, motor and choice planning, and motor initiation References Agster, K. L., & Burwell, R. D. (2009). Cortical efferents of the perirhinal, postrhinal, and entorhinal cortices of the rat. Hippocampus, 19(12), 1159-1186. Burcham, K. J., Corwin, J. V., Stoll, M. L., & Reep, R. L. (1997). Disconnection of medial agranular and posterior parietal cortex produces multimodal neglect in rats. Behav Brain Res, 86(1), 41-47. Burwell, R. D., & Amaral, D. G. (1998b). Cortical afferents of the perirhinal, postrhinal, and entorhinal cortices of the rat. The Journal of comparative neurology, 398(2), 179-205. Buzsàki, G. (2006). Rhythms of the brain. New York, NY: Oxford University Press. Reep, R. L., Corwin, J. V., Hashimoto, A., & Watson, R. T. (1987). Efferent connections of the rostral portion of medial agranular cortex in rats. Brain Res Bull, 19(2), 203-221. Winters, B. D., & Bussey, T. J. (2005b). Transient inactivation of perirhinal cortex disrupts encoding, retrieval, and consolidation of object recognition memory. The Journal of neuroscience, 25(1), 52-61. Schematic of the Go/Delay-Go task. (A) The test arena and behavior zones as viewed from the CinePlex tracking system. The solid white and dashed circles constituted the image pair. (B) Flow diagram of the Go/Delay-Go task. Figure adapted from Burwell et al., 2012. Rats received two surgeries. First, we implanted bipolar electrodes in MFB, and following recovery, shaped rats on the task before transferring them to a fully automated version. After 5–10 days of training, we implanted two drivable wire bundles, each consisting of four stereotrodes, into caudal PER and AGm. We then retrained rats on the task. We acquired wide band data passed through a 64-channel OmniPlex differential preamp with a gain of 12.5. LFPs were low-pass filtered (0–200 Hz) and acquired at a sampling rate of 1 kHz. We analyzed behavioral data in MATLAB and neural data in NeuroExplorer and the MATLAB Chronux toolbox for multitaper spectral analysis. We computed power spectra and spectrograms using nine tapers and a time-bandwidth product of 5 (500 ms x 10 Hz). We computed spectrograms over 1401 ms blocks (±700 ms from stimulus presentation) using a 500 ms sliding window (10 ms window step). Additionally, we computed coherence and coherograms between PER and AGm. Acknowledgements Representative examples of single trial local field potentials and spectrograms. The dashed line denotes stimulus onset. This trial was a correct Go trial. (A) Normalized local field potential traces. Top: PER; bottom: AGm. (B) Log power spectrograms in the low gamma band, calculated ±700 ms from stimulus and displayed on a central 700 ms window. Top: PER; bottom: AGm. The author wishes to acknowledge the guidance and invaluable contributions of Dr. Rebecca Burwell, Dr. Jonathan Ho, Dr. Tara Jacobson, Amanda Liu, the Burwell Laboratory, Dr. Thomas Serre, Dr. Carlos Vargas-Irwin, and Dr. Wilson Truccolo.