Download

1 / 65
650 likes | 902 Vues
MAP for Primary Grades. M. Setting the Stage. Welcome/introductions Intended accomplishments Activate prior knowledge. M. R. A. O. M. *. Sustaining the Momentum. Consider how you will implement what you’ve learned in the: Next month Next semester Next year. M. Topics for Today.

E N D
Setting the Stage • Welcome/introductions • Intended accomplishments • Activate prior knowledge M R A O M
* Sustaining the Momentum • Consider how you will implement what you’ve learned in the: • Next month • Next semester • Next year M
Topics for Today Section 1 • Understanding Components and Key Features of MAP for Primary Grades Section 2 • Administering the Test Successfully Section 1 • Understanding Components and Key Features of MAP for Primary Grades Section 3 • Accessing Reports and Using the Data
Section 1: Intended Accomplishments • Identify differences between MAP for Primary Grades and standard MAP tests • Understand features of each test in the tiered assessment system • Develop student placement plans
Assessing Primary Grades Students • Assists with documentation of mastery of foundational skills in reading and mathematics • Informs instructional decision making • Aligns with the needs of the primary student and teacher • Provides first point in long-term measure of student academic growth A
Same RIT scale Adaptive tests Growth measure Reports Different Administration Tiered assessment system Data Reports and resources DesCartes Enhanced items with audio MAP for Primary Grades vs. Standard MAP Tests (for grades 2 and up)
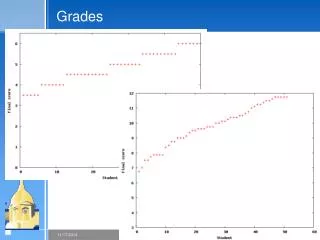
Rasch unIT (RIT) Scale Grade Level Norms RIT Skill Data • Achievement scale • Equal-interval • Used to show growth over time • Scale has the same meaning regardless of the students’ grade level or items taken 250 10 Instructional Data or DesCartes 9 8 7 6 5 4 3 2 1 K 120
RIT Scale • MAP for Primary Grades adaptive tests: • Extend the RIT scale to valid scores as low as 110 • Reach ranges as high as approximately 230 - 240 on the RIT scale • Consider transitioning students to standard MAP testing when • Students have been exposed to the content in standard MAP tests AND • When they no longer need the support of audio enhanced items OR • When students reach or exceed a score of 210 on the RIT scale
Addressing Classroom Diversity:MAP for Primary Grades Adaptive Tests Adult Reading • Challenging, appropriate, and dynamically developed for every student • Untimed • Purpose is internal accountability • Measures growth in student achievement • Immediate results • Can test up to twice per year Adult Reading x - - x - - + + + + + 129 + x x 1st Grade x + 5th Grade x x x x x x x x x x Beginning Literacy Beginning Literacy
Instructional Level vs. Mastery • MAP for Primary Grades Prerequisite tests and Skills Checklist tests assess mastery of foundational skills • MAP for Primary Grades Survey with Goals tests provide the instructional level of the student
Measuring Academic Growth • Survey with Goals tests (adaptive) • Take into account students’ starting points • Assess progress as well as proficiency A
Tiered Assessment System • Prerequisite tests (mastery tests) • Assess basic letter/number skills • Skills Checklist tests (mastery tests) • Assess developing literacy/numeracy skills • Survey with Goals tests (adaptive tests) • Measures growth in reading and mathematics skills M
Reading and Mathematics Prerequisite Tests • Test types • Reading: Letter Recognition, Sounds, Concepts of Print • Mathematics: Concepts of Number • Fixed form tests (mastery tests) • Assesses foundational skills of letters and numbers • Measures discrete essential skills • Guides instruction • Takes place of most typical one-on-one testing • Audience: Pre-kindergarten, fall kindergarten • Test intervals: repeat as often as needed M
Reading Skills Checklist Tests • Seven Fixed form tests (mastery tests) • Assesses building blocks to basic literacy • Measures discrete essential skills • Guides instruction • Takes the place of typical one-on-one testing • Audience: Pre-kindergarten, kindergarten, first grade, intervention in grades 2+ • Testing interval: repeat as often as needed • Two reading goals measured • Phonological awareness – two tests • Phonics – five tests M
Mathematics Skills Checklist Tests • Nine Fixed form tests (mastery tests) • Assesses basic concepts in mathematics • Measures discrete essential skills • Guides instruction • Takes the place of typical one-on-one testing • Audience: kindergarten, first grade, and second grade • Testing Interval: repeat as often as needed • Two mathematics goals measured • Number sense – four tests • Computation – five tests M
Audience K -1 students successful with other tests in the system Some grade 2 students; intervention screening in grades 3 and 4 Scores RIT score for each test Intervals for testing Twice per year During district testing windows Instructional Data document Learning statements organized by RIT level (Future) DesCartes aligned to state goal structures Survey with Goals M
Reading Survey with Goals Tests • One Reading Survey with Goals test measures • Phonemic Awareness • Phonics, Letters, Sounds • Concepts of Print • The other Survey with Goals test measures • Vocabulary and Word Structure • Comprehension • Writing M
Mathematics Survey with Goals Tests • One Mathematics Survey with Goals test measures • Problem Solving • Number Sense • Computation • The other Survey with Goals test measures • Measurement and Geometry • Statistics and Probability • Algebra M
Primary grades algebra Copies a repeating pattern using different geometric shapes Extends a repeating pattern – pictures of real-world objects Primary grades probability/statistics Reads a pictograph – using scale of 1 symbol = 1 object Reads a tally chart Primary grades geometry/measurement Identifies or names a square Identifies the lightest object Identifies real-world situations that are cold Examples of Mathematics Concepts M
Placement Decisions • Considerations • Student readiness • District data needs • Instructional uses M
Student Readiness • Previous teacher’s recommendations • Prior assessment results • Information shared by parents • Teacher observation of students M
District Data Needs • Mastery documentation: administer Prerequisite and/or Skills Checklist tests • Growth data: administer Survey with Goals tests • Lexile scores: administer Survey with Goals test named “Primary Gr-READ-Vocab and Word Struct, Comprehension, Writing V2” M
Instructional Uses • Identify foundational skills for mastery: administer Prerequisite and/or Skills Checklist tests • Group students for instruction: administer any tests in the system • Assess needs for intervention: administer any tests in the system • Evaluate student academic growth: administer Survey with Goals tests M
Placement Decisions • Who will we test? • What tiers of the system best fit our needs? • What additional input do we need to make final decisions? • How will we communicate placements decisions? A M
Section 1: Wrap Up • What are the components and key features of MAP for Primary Grades? • What does it test? • How does the testing system work? • How does the system fit with our other assessments? • Who will we test? What tests will we give them? A
Sustaining the Momentum • Consider how you will implement what you’ve learned: • Who will take the test? • How will this impact our current assessment program for primary grades? A M
Topics for Today Section 1 • Understanding Components and Key Features of MAP for Primary Grades Section 2 • Administering the Test Successfully Section 2 • Administering the Test Successfully Section 3 • Accessing Reports and Using the Data
Section 2: Intended Accomplishments • Communicating implementation plan • Preparing students, staff, and computers
MAP Coordinator Key point of communication with NWEA Technical Coordinator Coordinates implementation Technology readiness and setup Set up computers in labs and/or classrooms Proctors/Teachers Prepare computers for testing groups Select tests needed for each student Monitor ongoing testing event Print end-of-test score screens Roles in Test Administration
Accessing the Support & Training Page • www.nwea.org • Member Support • MAP for Primary Grades • Support & Training • Registration for updates Please note: Check this site for updates and current information related to new releases.
Support & Training Page: Links • Find links to: • Download all software, including new TestTaker version • MAP for Primary Grades Recorded Online Training • [password: MPGprimary] • “Test Warm-up” flash presentation • DataBridge info (optional) • CRF realignment info (optional)
Roles and Responsibilities Checklist Technical Requirements Classroom Testing Requirements Installation Instructions & User Guide Proctor and Teacher Instructions Recorded Session instructions Online Training Handout Guidelines for Placing Students Test Descriptions Test Name List Placement Process Activity Page Sustaining the Momentum Planning Page Support & Training Page: Documents and Information
Before Testing: Class Roster File • Preparing the class roster file (CRF) • Include primary grades students • Kindergarten grade identified by 13; Pre-kindergarten identified by 14 • If using Databridge, see link at MAP for Primary Grades Support & Training page for special directions • If current season CRF has been submitted without primary students, see link at MAP for Primary Grades Support & Training page for special directions • Allow 14 days processing time prior to test administration
Before Testing: Downloads • Download from the NWEA Secure TestTaker page • NEW version of TestTaker • Audio files • Collector Application • Download from TAA (after CRF is enrolled) • Test packages • Student data • Agency data
Before Testing: Schedules • MAP for Primary Grades will be available for downloading on or after August 15, 2006 • Primary students may be scheduled for multiple tests within the same testing window • Shorter block recommended (anticipate 1/2 hour per test)
Before Testing: Preparing Computers • Proctor reviews “Test Warm-up” at MAP for Primary Grades Support & Training page • Prepare student headphone sets • Check volume on computer settings • Check the mouse at each computer • If using classroom computers for testing, refer to Classroom Testing Requirements document
Before Testing: Test Warm-up Activity • Computer activity for students to practice • interacting with all item types • using audio options • selecting answer choices • Download and install on computers where students will complete the activity • Schedule times for all students • Allow approximately ½ hour for each group
Before Testing: Test Selection • Identify and communicate which tests are to be given based on placement decisions • Create student/test placement list • Distribute to Proctors • Print MAP for Primary Grades test names list • Post in testing areas
During Testing • Proctors and Teachers • Critical: Careful selection of tests • To pause and resume tests, use ‘control/shift/p’ on PCs; ‘command/shift/p’ on MACs • To activate continue button to proceed to end-of-test score screen, use ‘control/shift /k’ on PCs or ‘command/shift/k’ on MACs • Familiarization items appear prior to scored items • Print end-of-test score screen after each test
Mathematics Prerequisite Test Items • Based upon student’s understanding of numbers, test will give student • 8 items only – if student cannot rote count to 10 or • 18 items only – if student does not understand one to one correspondence or • All 51 items
Section 2: Wrap Up • What are our next steps for successful implementation of the test? • Have we: • Established testing dates? • Identified critical dates for steps necessary prior to testing? • Identified persons responsible for next steps? • Informed and prepared teachers and proctors? • Prepared students? A M
Sustaining the Momentum • Consider how you will implement what you’ve learned: • Fall testing • Spring testing • Next year A M
Topics for Today Section 1 • Understanding Components and Key Features of MAP for Primary Grades Section 2 • Administering the Test Successfully Section 3 • Accessing Reports and Using the Data Section 3 • Accessing Reports and Using the Data
Section 3: Intended Accomplishments • Access your MAP for Primary Grades reports • Use data for instructional purposes
Never Use Only One Point of Data Triangulation State Local -Classroom Periodic
Availability of Your Data • Immediate • End-of-test score screen provides preliminary data • 24 – 48 hours after testing • User Name and Passwords distributed to teachers by MAP coordinator or building principal • Access reports at www.nwea.org, click on “Reports Site” • Online reports • 72 hours after district summary reports have been ordered • Some Survey with Goals reports will be available Note: Currently MAP for Primary Grades data will not display in the Dynamic Reporting Suite platform (future)
Placeholder for navigation issues to MAP for Primary Grades reports Accessing Your Data Links to access various Survey with Goals reports and resources Link to access Prerequisite and Skills Checklist reports: mid-September, 2006 MAP for Primary Grades MAP for Primary Grades Instructional Data
Prerequisite Test Reports: End-of-Test Score Screen Mock-up Report When numbers are filled in, student has correctly answered the item
Prerequisite Test Reports: Class Report Mock-up Report Lo – (Default 0% to 59%) Av – (Default 60% to 79%) Hi – (Default 80% to 100%) Number represents percentage of students in this class who have responded correctly to this item