Download
1 / 1
10 likes | 100 Vues
Creating interactive animations for teaching science Bekolay, Trevor 1 , Metz, Don 2 , Klassen, Stephen 2 , Martin, Brian 3 , Mahaffy, Peter 3. Introduction. Rutherford scattering. Electricity. Roemer’s experiment.

E N D
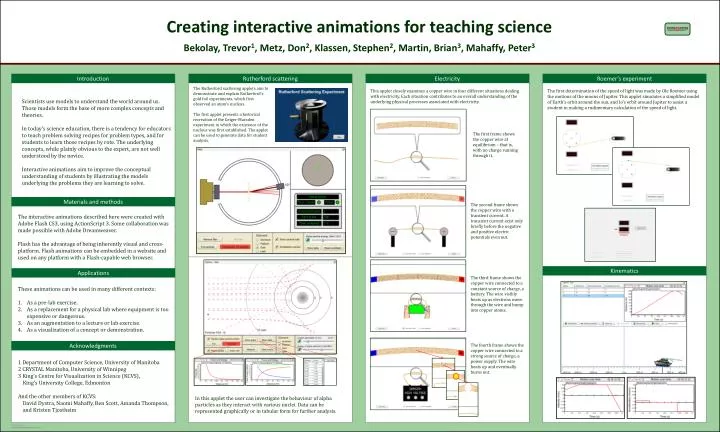
Creating interactive animations for teaching science Bekolay, Trevor1, Metz, Don2, Klassen, Stephen2, Martin, Brian3, Mahaffy, Peter3 Introduction Rutherford scattering Electricity Roemer’s experiment The Rutherford scattering applets aim to demonstrate and explain Rutherford’s gold foil experiments, which first observed an atom’s nucleus. The first applet presents a historical recreation of the Geiger-Marsden experiment in which the existence of the nucleus was first established. The applet can be used to generate data for student analysis. The first determination of the speed of light was made by Ole Roemer using the motions of the moons of Jupiter. This applet simulates a simplified model of Earth’s orbit around the sun, and Io’s orbit around Jupiter to assist a student in making a rudimentary calculation of the speed of light. This applet closely examines a copper wire in four different situations dealing with electricity. Each situation contributes to an overall understanding of the underlying physical processes associated with electricity. Scientists use models to understand the world around us. Those models form the base of more complex concepts and theories. In today’s science education, there is a tendency for educators to teach problem solving recipes for problem types, and for students to learn those recipes by rote. The underlying concepts, while plainly obvious to the expert, are not well understood by the novice. Interactive animations aim to improve the conceptual understanding of students by illustrating the models underlying the problems they are learning to solve. The first frame shows the copper wire at equilibrium – that is, with no charge running through it. Materials and methods The second frame shows the copper wire with a transient current. A transient current exist only briefly before the negative and positive electric potentials even out. The interactive animations described here were created with Adobe Flash CS3, using ActionScript 3. Some collaboration was made possible with Adobe Dreamweaver. Flash has the advantage of being inherently visual and cross-platform. Flash animations can be embedded in a website and used on any platform with a Flash-capable web browser. Kinematics Applications The third frame shows the copper wire connected to a constant source of charge, a battery. The wire visibly heats up as electrons move through the wire and bump into copper atoms. • These animations can be used in many different contexts: • As a pre-lab exercise. • As a replacement for a physical lab where equipment is too expensive or dangerous. • As an augmentation to a lecture or lab exercise. • As a visualization of a concept or demonstration. The fourth frame shows the copper wire connected to a strong source of charge, a power supply. The wire heats up and eventually burns out. Acknowledgments 1 Department of Computer Science, University of Manitoba 2 CRYSTAL Manitoba, University of Winnipeg 3 King’s Centre for Visualization in Science (KCVS),King’s University College, Edmonton And the other members of KCVS:David Dystra, Naomi Mahaffy, Ben Scott, Amanda Thompson, and Kristen Tjostheim In this applet the user can investigate the behaviour of alpha particles as they interact with various nuclei. Data can be represented graphically or in tabular form for further analysis.