Download
1 / 52
520 likes | 607 Vues
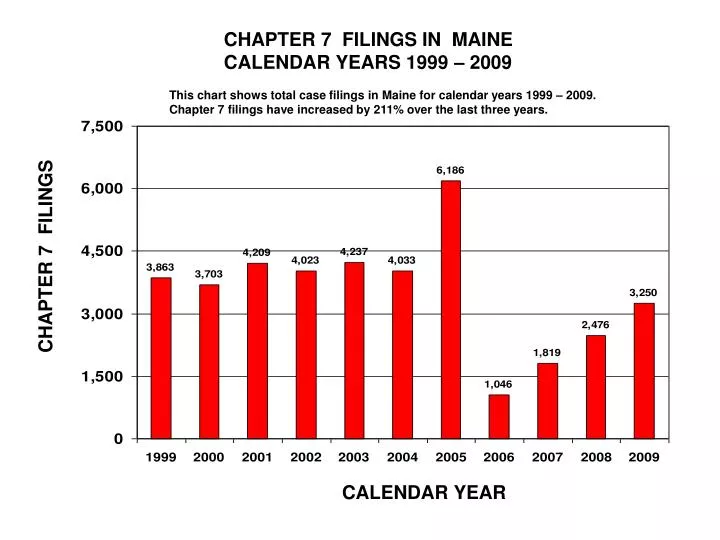
CHAPTER 7 FILINGS IN MAINE CALENDAR YEARS 1999 – 2009. This chart shows total case filings in Maine for calendar years 1999 – 2009. Chapter 7 filings have increased by 211% over the last three years. CHAPTER 7 FILINGS. CALENDAR YEAR.

E N D
CHAPTER 7 FILINGS IN MAINE CALENDAR YEARS 1999 – 2009 This chart shows total case filings in Maine for calendar years 1999 – 2009. Chapter 7 filings have increased by 211% over the last three years. CHAPTER 7 FILINGS CALENDAR YEAR
CHAPTER 7 FILINGS IN MASSACHUSETTS CALENDAR YEARS 1999 – 2009 This chart shows total case filings in Massachusetts for calendar years 1999 – 2009. Chapter 7 filings have increased by 209% over the last three years. CHAPTER 7 FILINGS CALENDAR YEAR
CHAPTER 7 FILINGS IN NEW HAMPSHIRE CALENDAR YEARS 1999 – 2009 This chart shows total case filings in New Hampshire for calendar years 1999 – 2009. Chapter 7 filings have increased by 207% over the last three years. CHAPTER 7 FILINGS CALENDAR YEAR
CHAPTER 7 FILINGS IN RHODE ISLAND CALENDAR YEARS 1999 – 2009 This chart shows total case filings in Rhode Island for calendar years 1999 – 2009. Chapter 7 filings have increased by 239% over the last three years. CHAPTER 7 FILINGS CALENDAR YEAR
CHAPTER 7 FILINGS IN PUERTO RICO CALENDAR YEARS 1999 – 2009 This chart shows total case filings in Puerto Rico for calendar years 1999 – 2009. Chapter 7 filings have increased by 143% over the last three years. CHAPTER 7 FILINGS CALENDAR YEAR
CHAPTER 7 FILINGS IN CONNECTICUT CALENDAR YEARS 1999 – 2009 This chart shows total case filings in Connecticut for calendar years 1999 – 2009. Chapter 7 filings have increased by 148% over the last three years. CHAPTER 7 FILINGS CALENDAR YEAR
CHAPTER 7 FILINGS IN NEW YORK CALENDAR YEARS 1999 – 2009 This chart shows total case filings in New York for calendar years 1999 – 2009. Chapter 7 filings have increased by 113% over the last three years. CHAPTER 7 FILINGS CALENDAR YEAR
CHAPTER 7 FILINGS IN VERMONT CALENDAR YEARS 1999 – 2009 This chart shows total case filings in Vermont for calendar years 1999 – 2009. Chapter 7 filings have increased by 150% over the last three years. CHAPTER 7 FILINGS CALENDAR YEAR
CHAPTER 7 FILINGS IN DELAWARE CALENDAR YEARS 1999 – 2009 This chart shows total case filings in Delaware for calendar years 1999 – 2009. Chapter 7 filings have increased by 225% over the last three years. CHAPTER 7 FILINGS CALENDAR YEAR
CHAPTER 7 FILINGS IN NEW JERSEY CALENDAR YEARS 1999 – 2009 This chart shows total case filings in New Jersey for calendar years 1999 – 2009. Chapter 7 filings have increased by 238% over the last three years. CHAPTER 7 FILINGS CALENDAR YEAR
CHAPTER 7 FILINGS IN PENNSYLVANIA CALENDAR YEARS 1999 – 2009 This chart shows total case filings in Pennsylvania for calendar years 1999 – 2009. Chapter 7 filings have increased by 97% over the last three years. CHAPTER 7 FILINGS CALENDAR YEAR
CHAPTER 7 FILINGS IN MARYLAND CALENDAR YEARS 1999 – 2009 This chart shows total case filings in Maryland for calendar years 1999 – 2009. Chapter 7 filings have increased by 320% over the last three years. CHAPTER 7 FILINGS CALENDAR YEAR
CHAPTER 7 FILINGS IN NORTH CAROLINA CALENDAR YEARS 1999 – 2009 This chart shows total case filings in North Carolina for calendar years 1999 – 2009. Chapter 7 filings have increased by 91% over the last three years. CHAPTER 7 FILINGS CALENDAR YEAR
CHAPTER 7 FILINGS IN SOUTH CAROLINA CALENDAR YEARS 1999 – 2009 This chart shows total case filings in South Carolina for calendar years 1999 – 2009. Chapter 7 filings have increased by 189% over the last three years. CHAPTER 7 FILINGS CALENDAR YEAR
CHAPTER 7 FILINGS IN VIRGINIA CALENDAR YEARS 1999 – 2009 This chart shows total case filings in Virginia for calendar years 1999 – 2009. Chapter 7 filings have increased by 244% over the last three years. CHAPTER 7 FILINGS CALENDAR YEAR
CHAPTER 7 FILINGS IN WEST VIRGINIA CALENDAR YEARS 1999 – 2009 This chart shows total case filings in West Virginia for calendar years 1999 – 2009. Chapter 7 filings have increased by 129% over the last three years. CHAPTER 7 FILINGS CALENDAR YEAR
CHAPTER 7 FILINGS IN LOUISIANA CALENDAR YEARS 1999 – 2009 This chart shows total case filings in Louisiana for calendar years 1999 – 2009. Chapter 7 filings have increased by 59% over the last three years. CHAPTER 7 FILINGS CALENDAR YEAR
CHAPTER 7 FILINGS IN MISSISSIPPI CALENDAR YEARS 1999 – 2009 This chart shows total case filings in Mississippi for calendar years 1999 – 2009. Chapter 7 filings have increased by 92% over the last three years. CHAPTER 7 FILINGS CALENDAR YEAR
CHAPTER 7 FILINGS IN TEXAS CALENDAR YEARS 1999 – 2009 This chart shows total case filings in Texas for calendar years 1999 – 2009. Chapter 7 filings have increased by 83% over the last three years. CHAPTER 7 FILINGS CALENDAR YEAR
CHAPTER 7 FILINGS IN KENTUCKY CALENDAR YEARS 1999 – 2009 This chart shows total case filings in Kentucky for calendar years 1999 – 2009. Chapter 7 filings have increased by 128% over the last three years. CHAPTER 7 FILINGS CALENDAR YEAR
CHAPTER 7 FILINGS IN MICHIGAN CALENDAR YEARS 1999 – 2009 This chart shows total case filings in Michigan for calendar years 1999 – 2009. Chapter 7 filings have increased by 172% over the last three years. CHAPTER 7 FILINGS CALENDAR YEAR
CHAPTER 7 FILINGS IN OHIO CALENDAR YEARS 1999 – 2009 This chart shows total case filings in Ohio for calendar years 1999 – 2009. Chapter 7 filings have increased by 142% during the last three years. CHAPTER 7 FILINGS CALENDAR YEAR
CHAPTER 7 FILINGS IN TENNESSEE CALENDAR YEARS 1999 – 2009 This chart shows total case filings in Tennessee for calendar years 1999 – 2009. Chapter 7 filings have increased by 149% over the last three years. CHAPTER 7 FILINGS CALENDAR YEAR
CHAPTER 7 FILINGS IN ILLINOIS CALENDAR YEARS 1999 – 2009 This chart shows total case filings in Illinois for calendar years 1999 – 2009. Chapter 7 filings have increased by 196% over the last three years. CHAPTER 7 FILINGS CALENDAR YEAR
CHAPTER 7 FILINGS IN INDIANA CALENDAR YEARS 1999 – 2009 This chart shows total case filings in Indiana for calendar years 1999 – 2009. Chapter 7 filings have increased by 147% over the last three years. CHAPTER 7 FILINGS CALENDAR YEAR
CHAPTER 7 FILINGS IN WISCONSIN CALENDAR YEARS 1999 – 2009 This chart shows total case filings in Wisconsin for calendar years 1999 – 2009. Chapter 7 filings have increased by 170% over the last three years. CHAPTER 7 FILINGS CALENDAR YEAR
CHAPTER 7 FILINGS IN ARKANSAS CALENDAR YEARS 1999 – 2009 This chart shows total case filings in Arkansas for calendar years 1999 – 2009. Chapter 7 filings have increased by 107% over the last three years. CHAPTER 7 FILINGS CALENDAR YEAR
CHAPTER 7 FILINGS IN IOWA CALENDAR YEARS 1999 – 2009 This chart shows total case filings in Iowa for calendar years 1999 – 2009. Chapter 7 filings have increased by 117% over the last three years. CHAPTER 7 FILINGS CALENDAR YEAR
CHAPTER 7 FILINGS IN MINNESOTA CALENDAR YEARS 1999 – 2009 This chart shows total case filings in Minnesota for calendar years 1999 – 2009. Chapter 7 filings have increased by 206% over the last three years. CHAPTER 7 FILINGS CALENDAR YEAR
CHAPTER 7 FILINGS IN MISSOURI CALENDAR YEARS 1999 – 2009 This chart shows total case filings in Missouri for calendar years 1999 – 2009. Chapter 7 filings have increased by 135% over the last three years. CHAPTER 7 FILINGS CALENDAR YEAR
CHAPTER 7 FILINGS IN NEBRASKA CALENDAR YEARS 1999 – 2009 This chart shows total case filings in Nebraska for calendar years 1999 – 2009. Chapter 7 filings have increased by 98% over the last three years. CHAPTER 7 FILINGS CALENDAR YEAR
CHAPTER 7 FILINGS IN NORTH DAKOTA CALENDAR YEARS 1999 – 2009 This chart shows total case filings in North Dakota for calendar years 1999 – 2009. Chapter 7 filings have increased by 120% over the last three years. CHAPTER 7 FILINGS CALENDAR YEAR
CHAPTER 7 FILINGS IN SOUTH DAKOTA CALENDAR YEARS 1999 – 2009 This chart shows total case filings in South Dakota for calendar years 1999 – 2009. Chapter 7 filings have increased by 111% over the last three years. CHAPTER 7 FILINGS CALENDAR YEAR
CHAPTER 7 FILINGS IN ALASKA CALENDAR YEARS 1999 – 2009 This chart shows total case filings in Alaska for calendar years 1999 – 2009. Chapter 7 filings have increased by 58% over the last three years. CHAPTER 7 FILINGS CALENDAR YEAR
CHAPTER 7 FILINGS IN ARIZONA CALENDAR YEARS 1999 – 2009 This chart shows total case filings in Arizona for calendar years 1999 – 2009. Chapter 7 filings have increased by 352% over the last three years. CHAPTER 7 FILINGS CALENDAR YEAR
CHAPTER 7 FILINGS IN CALIFORNIA CALENDAR YEARS 1999 – 2009 This chart shows total case filings in California for calendar years 1999 – 2009. Chapter 7 filings have increased by 461% over the last three years. CHAPTER 7 FILINGS CALENDAR YEAR
CHAPTER 7 FILINGS IN HAWAII CALENDAR YEARS 1999 – 2009 This chart shows total case filings in Hawaii for calendar years 1999 – 2009. Chapter 7 filings have increased by 212% over the last three years. CHAPTER 7 FILINGS CALENDAR YEAR
CHAPTER 7 FILINGS IN IDAHO CALENDAR YEARS 1999 – 2009 This chart shows total case filings in Idaho for calendar years 1999 – 2009. Chapter 7 filings have increased by 191% over the last three years. CHAPTER 7 FILINGS CALENDAR YEAR
CHAPTER 7 FILINGS IN MONTANA CALENDAR YEARS 1999 – 2009 This chart shows total case filings in Montana for calendar years 1999 – 2009. Chapter 7 filings have increased by 45% over the last three years. CHAPTER 7 FILINGS CALENDAR YEAR
CHAPTER 7 FILINGS IN NEVADA CALENDAR YEARS 1999 – 2009 This chart shows total case filings in Nevada for calendar years 1999 – 2009. Chapter 7 filings have increased by 506% over the last three years. CHAPTER 7 FILINGS CALENDAR YEAR
CHAPTER 7 FILINGS IN OREGON CALENDAR YEARS 1999 – 2009 This chart shows total case filings in Oregon for calendar years 1999 – 2009. Chapter 7 filings have increased by 151% over the last three years. CHAPTER 7 FILINGS CALENDAR YEAR
CHAPTER 7 FILINGS IN WASHINGTON CALENDAR YEARS 1999 – 2009 This chart shows total case filings in Washington for calendar years 1999 – 2009. Chapter 7 filings have increased by 191% over the last three years. CHAPTER 7 FILINGS CALENDAR YEAR
CHAPTER 7 FILINGS IN COLORADO CALENDAR YEARS 1999 – 2009 This chart shows total case filings in Colorado for calendar years 1999 – 2009. Chapter 7 filings have increased by 193% over the last three years. CHAPTER 7 FILINGS CALENDAR YEAR
CHAPTER 7 FILINGS IN KANSAS CALENDAR YEARS 1999 – 2009 This chart shows total case filings in Kansas for calendar years 1999 – 2009. Chapter 7 filings have increased by 82% over the last three years. CHAPTER 7 FILINGS CALENDAR YEAR
CHAPTER 7 FILINGS IN NEW MEXICO CALENDAR YEARS 1999 – 2009 This chart shows total case filings in New Mexico for calendar years 1999 – 2009. Chapter 7 filings have increased by 155% over the last three years. CHAPTER 7 FILINGS CALENDAR YEAR
CHAPTER 7 FILINGS IN OKLAHOMA CALENDAR YEARS 1999 – 2009 This chart shows total case filings in Oklahoma for calendar years 1999 – 2009. Chapter 7 filings have increased by 120% over the last three years. CHAPTER 7 FILINGS CALENDAR YEAR
CHAPTER 7 FILINGS IN UTAH CALENDAR YEARS 1999 – 2009 This chart shows total case filings in Utah for calendar years 1999 – 2009. Chapter 7 filings have increased by 179% over the last three years. CHAPTER 7 FILINGS CALENDAR YEAR
CHAPTER 7 FILINGS IN WYOMING CALENDAR YEARS 1999 – 2009 This chart shows total case filings in Wyoming for calendar years 1999 – 2009. Chapter 7 filings have increased by 101% over the last three years. CHAPTER 7 FILINGS CALENDAR YEAR
CHAPTER 7 FILINGS IN ALABAMA CALENDAR YEARS 1999 – 2009 This chart shows total case filings in Alabama for calendar years 1999 – 2009. Chapter 7 filings have increased by 121% over the last three years. CHAPTER 7 FILINGS CALENDAR YEAR
CHAPTER 7 FILINGS IN FLORIDA CALENDAR YEARS 1999 – 2009 This chart shows total case filings in Florida for calendar years 1999 – 2009. Chapter 7 filings have increased by 339% over the last three years. CHAPTER 7 FILINGS CALENDAR YEAR