Download
1 / 11
110 likes | 231 Vues

E N D
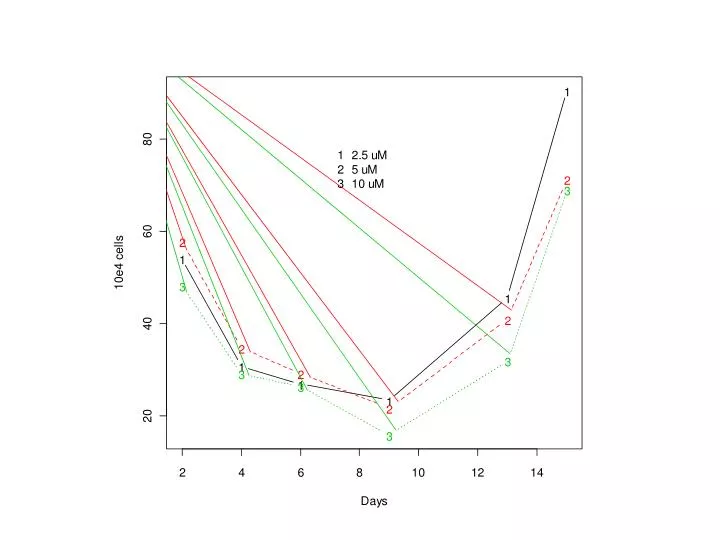
Let S(t) and R(t) represent the number of cells that are sensitive or resistant to imatinib. During imatinib exposure, assume zero growth and a death rate δ for sensitive cells, µ << δ as the rate at which sensitive cells mutate to resistance, and no death and a growth rate β for resistant cells. The two cell populations then follow: β µ S R δ Nested in optimizations performed to estimate the parameters β, δ and µ, these equations were integrated numerically using lsoda of the R package odesolve. The parameters were estimated in exponentiated forms to constrain them and their confidence intervals (CIs) to positive values (see Table 1). CIs were estimated from Hessians (matrices of second derivates) of the SSEs (sum of squared errors) evaluated at the optimum (minimum SSE) using the function optim in R: Hessians were divided by 2, inverted, multiplied by SSE/(N - P) where N and P are the number of data points and parameters, and square roots of the main diagonal were then be multiplied by 1.96 to form the 95% Wald CI (in Table 1).
Table 1. Parameter estimates of fit in Fig. 1. Units: rate constants=1/day, cells numbers=104.
CANCER RESEARCH 59, 4770–4775, October 1, 1999 Tumor Development under Angiogenic Signaling: A Dynamical Theory of Tumor Growth, Treatment Response, and Postvascular Dormancy Philip Hahnfeldt, DipakPanigrahy, Judah Folkman, and Lynn Hlatky V’=λV[log(K)-log(V)]
Model validation data V follows setpoint/carrying capacity K
With lambda2 fixed to zero and all else fitted to all of the data simultaneously, the fit was > g$params initial final opt CI95prct lambda1 1.92e-01 1.92e-01 TRUE (0.185, 0.202) lambda2 0.00e+00 0.00e+00 FALSE not fitted b 5.85e+00 5.78e+00 TRUE (5.47, 6.11) d 8.73e-03 8.73e-03 TRUE (0.00823, 0.00919) eT 1.30e+00 1.43e+00 TRUE (0.317, 6.42) ** 20 fold clrT 1.01e+01 1.02e+01 TRUE (3.22, 32.1) ** 10 fold • eA 1.50e-01 1.55e-01 TRUE (0.0043, 5.64) **** very wide (>1000-fold) CI clrA 3.80e-01 4.34e-01 TRUE (0.00236, 79.8) **** very wide CI **** eE 6.60e-01 5.84e-01 TRUE (0.228, 1.5) clrE 1.70e+00 2.07e+00 TRUE (0.814, 5.26) V0 1.80e+02 1.90e+02 TRUE (178, 202) V0valid 3.00e+02 2.81e+02 TRUE (200, 395) K0 6.25e+02 7.93e+02 TRUE (742, 846) Initital SSE = 2,314,351; Final SSE=750,720.4 Note that the nice initial fit in Endo at 20 mg/kg is sacrificed for a better final fit in endo at 4mg/kg (next page). Initial values take from here
Fits of initial parameter values (i.e. those given in Cancer Res. 1999)
Fits when data and model are normalized by the mean of the data The problem here is that the initial K0 is less than V0 initial final opt CI95prct • lambda1 1.92e-01 2.43e-01 TRUE (0.225, 0.262) • lambda2 0.00e+00 0.00e+00 FALSE not fitted • b 5.85e+00 5.56e+00 TRUE (4.85, 6.36) • d 8.73e-03 9.70e-03 TRUE (0.00823, 0.0114) • eT 1.30e+00 1.64e+00 TRUE (0.126, 21.1) • clrT 1.01e+01 9.46e+00 TRUE (1.67, 53.5) • eA 1.50e-01 9.30e-02 TRUE (0.0523, 0.165) • clrA 3.80e-01 2.59e-01 TRUE (0.0963, 0.696) • eE 6.60e-01 4.30e-01 TRUE (0.0993, 1.87) • clrE 1.70e+00 1.25e+00 TRUE (0.264, 5.93) • V0 1.80e+02 1.79e+02 TRUE (161, 198) • V0valid 3.00e+02 3.11e+02 TRUE (290, 334) • K0 6.25e+02 9.21e-03 TRUE (0.0076, 0.0112)