Download
1 / 60
600 likes | 705 Vues
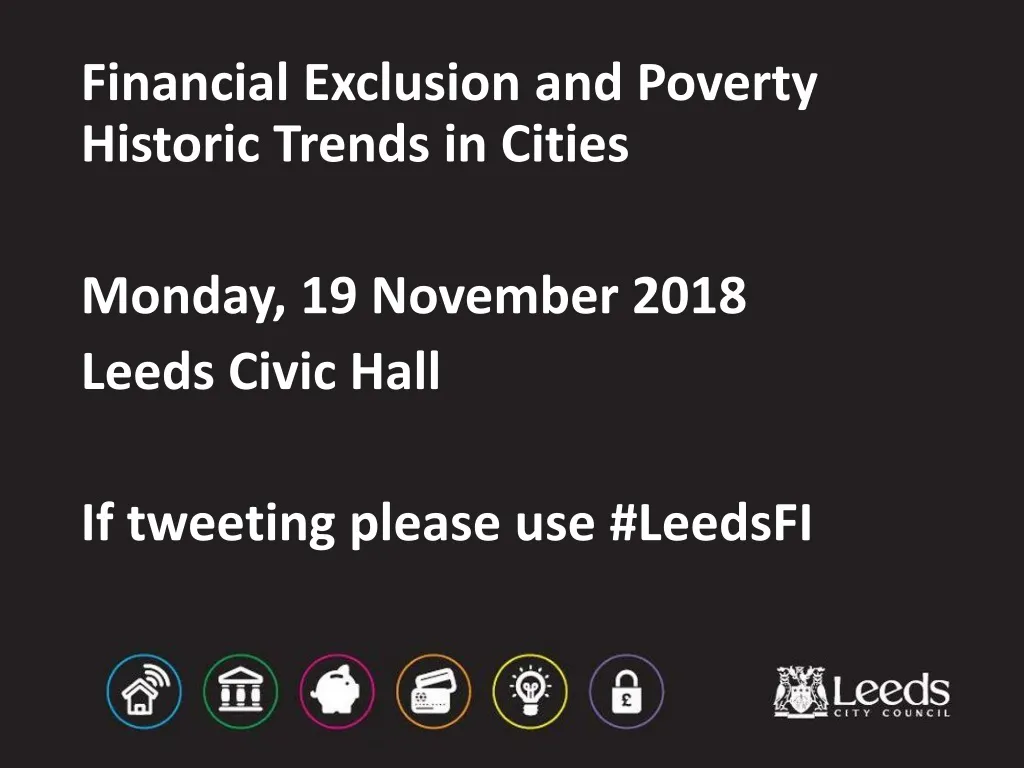
Financial Exclusion and Poverty Historic Trends in Cities. Monday, 19 November 2018 Leeds Civic Hall If tweeting please use # L eedsFI. Chair. James Rogers Director Communities and Environment Leeds City Council. Councillor Sharon Hamilton. Support Executive Member

E N D
Financial Exclusion and PovertyHistoric Trends in Cities Monday, 19 November 2018 Leeds Civic Hall If tweeting please use #LeedsFI
Chair James Rogers Director Communities and Environment Leeds City Council
Councillor Sharon Hamilton Support Executive Member Housing Management Leeds City Council
Dave Roberts Financial Inclusion Manager Leeds City Council
Financial Inclusion in Leeds Historic Context
In the Beginning Financial Inclusion in Leeds Work commenced 2003 Commissioned research – University of Salford Study completed late 2004 Dissemination conference early 2005
Within Leeds most deprived communities Key Findings Cash based economy Lower utilisation of bank accounts Higher dependency on doorstep lending Serious debt problems
University of Salford Key Partner
Subsequent Studies Economic Impact and Regeneration in City Economies – University of Salford – 2009 Improving Public Health through income maximisation– Leeds City Council – 2011
Subsequent Studies Evolution of Financial Inclusion in Leeds since 2004 – University of Salford – 2010 Problem Gambling in Leeds – Leeds Beckett University – 2016 Financial Exclusion and Poverty – University of Salford - 2018
Professor Karl Dayson and DrPålVik Community Finance Solutions University of Salford Helen Hardcastle and Miles Crosby Qa Research
Research into financial inclusion in Leeds – Presentation of findings Dr Pål Vik and Prof Karl Dayson Community Finance Solutions, University of Salford Helen Hardcastle and Miles Crosby Qa Research 19November 2018, Leeds Civic Hall, Leeds
Objectives of study: Determine evolution of financial exclusion and poverty in Leeds since 2004 and 2010 surveys Analyse effectiveness of financial inclusion services and interventions by Leeds CC and partners Overview of study
The sample for the research designed to: Replicate as far as possible the areas chosen in 2010. Be representative in terms of the population of these areas at the 2011 Census. Sampling – deprived sample Survey areas: Beeston Hill Belle Isle Gipton Halton Moor Harehills Holbeck Lincoln Green Little London Richmond Hill Seacroft South Farm Road Profile of sample:UnweightedWeighted TOTAL 602 602 Age 18-34 36% 42% Age 35-54 37% 35% Age 55+ 27% 23% Males 45% 48% Females 55% 52% White 68% 66% BME 32% 34% In employment 41% 51% Unemployed 10% 12% Econ. Inactive 49% 42%
The sample for the research designed to: Replicate as far as possible the areas chosen in 2010. Be representative in terms of the population of these areas at the 2011 Census. Sampling – economically average sample Survey areas: Oakwood /Gipton Wood Upper Armley Rothwell Yeadon Profile of sample:UnweightedWeighted TOTAL 320 320 Age 18-34 24% 29% Age 35-54 33% 35% Age 55+ 43% 36% Males 45% 48% Females 55% 52% White 90% 87% BME 10% 13% In employment 51% 59% Unemployed 04% 05% Econ. Inactive 46% 36%
To correct for minor variance between the target sample and the profile of the achieved sample, the deprived sample data was for the 2018 survey was: Weighted to 2011 Census profile based on age and employment Weighted to the to the tenure profile of the 2004 survey The economically average sample was; Weighted to 2011 Census profile based on gender, age, ethnicity, and employment Data weighting ensures that the profile of the sample matches the demographic profile of the subject areas, and also that data is comparable over time Sampling – weighting
All data presented here has been tested for statistical significance. Data has a natural degree of variance or ‘randomness’ – if the difference between two figures (e.g. 50% and 45%) is statistically significant then it means the difference between them is greater than the random variance and there is a measurable difference The degree of random variance is called the standard error. For this deprived sample this was +/-3.96%*. A standard error of less than +/-5.0% is said to be statistically robust – this means the findings from the sample can be said to reflect the findings for the whole population had everyone been surveyed. Sampling – significance * At 95% confidence interval
2004: The boom years Extended period economic growth; plethora financial inclusion initiatives; build-up of debt in lead up to financial crisis 2010: Eye of the storm Aftermath financial crisis & recession; credit crunch; job losses; rising debt & repossessions; high levels unemployment 2018: Economic growth and austerity Prolonged period low economic growth; rise precarious work; austerity; welfare reform; periodic growth real incomes; falling unemployment; recovery bank lending Changing context for survey
Tenure: Social housing tenants more likely to lack access to banking services, use high cost credit and be in financial difficulties Lone parents: Low levels of use of bank services, low levels of savings and a greater propensity to be in debt Income: People on low incomes and not in work less likely to be banked and to have savings Age: Younger age groups less likely to save and more likely to have debt problems Main determinants financial exclusion
Context important 2010 survey in aftermath greatest crisis since Great Depression Continuation of increase in banked households Greater bank account ownership – ongoing trend since 2004 Many don’t make full use of account – especially use of DD to pay bills Partial recovery in savings habit Around 40% deprived sample never save and have no savings Significant improvement on 2010 but significantly lower than in 2004 Some easing of debt issues 1/5 currently behind on bills; 13% on priority bills; lower than in 2010 but higher than in 2004 Concluding remarks
Fall in use of high cost credit Lower % use high cost credit – broadly in line with national trends; worryingly over 1/3 borrow to cover living costs More people aware of credit union 70% in 2018 compared with 45% in 2010 Credit union reaches most excluded Membership highest among social housing tenants and lone parent households Increase in seeking advice Proportion seeking advice more than doubled since 2004/2010 Social housing rented more likely to seek advice from CAB than other groups Concluding remarks
Deprived area respondents less resilient and prepared for external shocks than in 2004 Lower propensity to save & greater likelihood of being in debt Identify needs for two types of interventions: Enhance savings habit Support new & existing interventions to support households building savings habit Create surplus to save Need to support interventions building capacity to save (e.g. income maximisation, debt remedies, collective purchasing) Recommendations
Thank you – any questions? Dr Pål Vik and Prof Karl Dayson Community Finance Solutions, University of Salford Helen Hardcastle and Miles Crosby Qa Research
Chair Liza Kellett Chief Executive Trust Leeds
Rose Doran Senior Advisor Local Government Association
Reshaping financial support Rose Doran Senior Adviser Local Government Association 19th November 2018 www.local.gov.uk
Context • Pressures on low income households • Pressures on council budgets – making the case for prevention • Welfare reform and Universal Credit www.local.gov.uk
Why ‘reshaping financial support’? • Government narrative dominated by ‘employment’ (but not pay, progression or living costs) • Disconnect between welfare policy and housing / homelessness policy (affordability) • Relationship between the citizen and the state (digital by default) • Growth in ‘problem debt’ • Why poverty matters to local government
Scoping exercise • Ten councils, including Leeds • Identify good practice that can be built on in some (potential) pathfinders • Direct financial support • Indirect support and advice • Financial relationship and debt recovery • Financial health
Key findings • Councils have been working across service responsibilities and joining up their provision to better meet the needs of lower income households • Councils are improving customer journeys and resolving peoples’ problems earlier • Councils have been reviewing their approach to debt collection • Councils are leading financial inclusion partnerships to provide long term strategic direction to provision, and to support the development of financial services and products for low to middle income households
Pathfinders could… • Pro-actively identify people in financial difficulty and provide them with a more fully integrated offer of support • Trial the co-commissioning of advice provision with the Money Advice Service • Test out and learn from new innovations in advice provision and debt collection • Take advantage of new opportunities to boost investment in not-for-profit lenders and develop closer links between local authority support and these services.
With a hope to… • Aid future decision-making by councils on the costs and benefits of putting preventative approaches in place • Inform the ongoing development of good practice in local authority debt collection • Highlight and strengthen the role of local government (and its local partners) in the welfare system, and in supporting low income households
Contact: rose.doran@local.gov.uk 07747 636843
Chris Goulden Deputy Director Policy and Research Joseph Rowntree Foundation
Destitution in the UK 2018 Chris Goulden Deputy Director Evidence and Impact
Why do it and what did we ask? • Concerns around destitution have intensified since 2015 • How much UK destitution is there (in 2017)? • Who is affected by it? • What are the main pathways in? • What should we do about it?
Definition of destitution People who have lacked two or more of six essentials over the past month because they cannot afford them: • Shelter (slept rough for one or more nights) • Food (fewer than two meals a day for two or more days) • Heating their home (five or more days) • Lighting their home (five or more days) • Clothing and footwear (appropriate for weather) • Basic toiletries OR • Had an income so low that were unable to purchase these essentials for themselves
Methods • Case studies of destitution in 16 UK locations: • one-week user survey of 103 crisis services – 2,905 returns • 41 in-depth interviews • Secondary analysis of over 40 quantitative datasets enabled scaling up to national level