Download
1 / 79
790 likes | 904 Vues
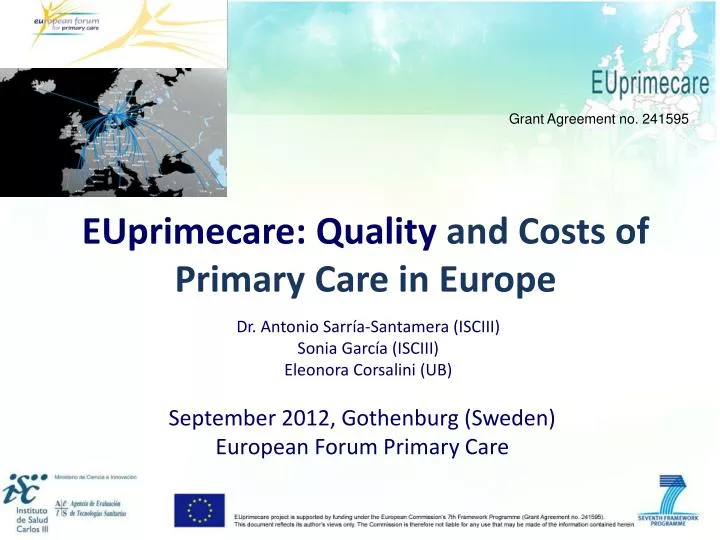
Grant Agreement no. 241595. EUprimecare : Quality and Costs of Primary Care in Europe. Dr. Antonio Sarría-Santamera (ISCIII) Sonia García (ISCIII) Eleonora Corsalini (UB). September 2012, Gothenburg (Sweden) European Forum Primary Care . Background.

E N D
Grant Agreement no. 241595 EUprimecare: Quality and Costs of Primary Care in Europe Dr. Antonio Sarría-Santamera (ISCIII) Sonia García (ISCIII) EleonoraCorsalini (UB) September 2012, Gothenburg (Sweden) European Forum Primary Care
Background • The goals of any healthcare system: • Deliver effective, safe, quality personal and non-personal health interventions to those that need them, when and where needed, with minimum waste of resources
Background • The Tallin Charter • Strengthening of health systems to improve people's health but keeping equity. • Primary Care • Basic structure of health system • Eliminating health disparities
Background • Common frameworkto describe Primary Care models in the EU is not available • Not yet developed a trans-national consensus on how to define quality of Primary Care • Cost of Primary Careare not well identified in national accounting systems
Objectives • To contribute to improving the knowledge regarding Primary Care in Europe: • exploring the relationships that could exist between Quality and Costs of different models and systems of organizing and delivering PC across Europe
Partners • Institute of Health Carlos III. ISCIII. Spain • Universität Bielefeld. UNIBI. Germany • University of Tartu. UTartu. Estonia • National Institute for Strategic Health Research. ESKI. Hungary • OrszágosAlapellátásiIntezet. OALI. Hungary • Institute for health and Welfare. THL. Finland • Kaunas University of Medicine. KMU. Lithuania • UniversitáCommerciale Luigi Bocconi. UB. Italy
WP 5 & 6 WP2 Identify a methodology to measure the PC quality To measure the health quality in PC COORDINATION WP 1 DISSMINATION WP 8 WP 7 WP 3 & 4 Identify a methodology to measure costs in PC To measure costs in PC Evaluation of PC models Conceptual structure
Approach • Costs • Quality:
Work package 2: Evaluation of PC models in Europe Methodological Approach of a Classification System of PC Models in Europe : Germany, Spain, Estonia, Finland, Hungary, Italia and Lithuania.
WP2: Methodology • Literature review • Structure or process of PC in Europe • Control knobs: financing, regulation, payment, organization, and organizational behavior • Selection of indicators=> template design: • 5 variables (Control knobs) to optimize healthcare systems results: • Range of services • DescriptiveAnalysis& Principal Component Analysis
Descriptive analysis (I) Mixed model (Hungary) 16% Double coverage FINANCING 7% Uninsured BISMARCK SS (Estonia, Germany, Lithuania) BEVERIDGE NHS (Finland, Italy, Spain) 10,5% Expenditure in HC as GDP 10,6% Private Insurance 18,8% Double coverage Expenditure in PC 6,1% 6,6% 24% 5,7%
Descriptive analysis (II) REGULATION • Formal mechanisms to guarantee accessibility, equity and quality of healthcare • Gate-keeping systems, except in Germany ORGANIZATION • Facilities: • Mostly public: Finland, Spain, Hungary and Lithuania • Totally private: Germany, Estonia and Italy • Clinical practice: • Integrated network: Finland and Spain • Solo and group practices: Germany, Estonia, Italy, Lithuania, Hungary
Descriptive analysis (III) ORGANIZATIONAL BEHAVIOUR • Process to monitoring and improving the quality of medical practice: • Quality management systems measuring clinical and no clinical quality indicators • Clinical practices guidelines • Continuing education
Quantitative analysis (PCA) Financing • Provision of services through national/regional/local health systems (Yes/No) • Private voluntary health insurance (Yes/No) • Geographical distribution of PC services (Yes/No) Regulation • Professional income (Capitation/Salary/Fee for service/Out of pocket) Payment • Gatekeeping for specialist (Yes/No) • Type of facilities (Public/private) • Type of clinical practice (Solo practice/Group practice/ Network) Organization • Improvement programs & Quality management systems (Yes/No) • Continuing clinical education program (Yes/No) • Local adaptation of clinical practice guideline(Yes/No) Organizational behavior
Results of Qualitative analysis Results • Based on a functional perspective, allowed to proposing 5 functional models: • Model 1: Direct access to any GP or specialist (Germany) • Model 2: Referral required from GP, mainly solo-practices in PC (Hungary, Italy) • Model 3: Referral required from GP, mainly group-practices in PC (Estonia, Lithuania) • Model 4: GPs working mainly in health care centres (Finland, Spain) • Model 5: Polyclinics (Shemasko). Not necessarily GPs at all Based on a functional perspective, allowed to proposing 5 models: Direct access to specialist Referral required from GP, mainly solo-practices in PC Referral required from GP, mainly group-practices in PC Health care centers Polyclinics
* *Predominance
Conclusions • Framework for classification of health systems based on PC • Multidimensional => more complex => more realistic • Healthcare services provision • Basic coverage • Gate-keeping • Private insurances • Professional payment • Type of facilities • Type of practice
Methodology Micro-costing • 4 clinical vignettes representing the main areas of activity of PC: • Acute care • Chronic care • Health promotion • Prevention (vaccination)
Methodology Macro-costing • Actual costs: Real not estimated • Usual accounting principles and practices • Indicated in the estimated overall budget
Methodology Quality Indicators • Focus Group Discussion : • Patients (n= 53) • Primary care professionals (n= 64) • 7 countries: Estonia, Finland, Germany, Hungary, Italy, Lithuania, Spain. • Helped to understand the views about quality in the different partner countries and to set a list of quality criteria. • Non-clinical indicators for each criteria were identified from the literature review and prioritized by scoring according to importance and measurability.
Methodology Quality Indicators • 60 Quality Indicators (aprox) selected to measure Quality of PC in Europe
Methodology Quality at the Population Level • Population Survey: • A sample of 3.020 persons • 25-75 years old • 7 countries participating in the project • Domains: • Socio-demographic • Satisfaction • Self-perceived health • Utilization of services • Prevention and health promotion interventions
Methodology Quality at the Clinical Level • Professional survey: • Medical records: • Diabetes and blood pressure high • 14 indicators • Specific approach for extracting data in each country (sample)
Work package 5&6: Quality Population survey-Satisfaction Results
OVERALL SATISFACTION WITH THE ATTENTION PROVIDED BY PC SERVICES (%)
Work package 7:Trade offs between PC Models, Quality and PC expenditure
PERCENTAGE OF PATIENTS DIAGNOSED BY THEIR PC DOCTORS ACCORDING TO FINANCING FEATURES
PERCENTAGE OF PATIENTS WHO ARE DIAGNOSED BY THEIR PC DOCTOR ACCORDING TO ORGANIZATIONAL FEATURES
FRECUENCY OF PREVENTION AND COUNSELING ACTIVITIES ACCORDING TO FINANCING FEATURES <1year <1-2year >2year
FRECUENCY OF PREVENTION AND COUNSELING ACTIVITIES ACCORDING TO ORGANIZATIONAL FEATURES <1year <1-2year >2year
SELF-PERCEIVED HEALTH STATUS ACCORDING TO FINANCING FEATURES
SELF-PERCEIVED HEALTH STATUS ACCORDING TO ORGANIZATIONAL FEATURES