Download
1 / 40
400 likes | 472 Vues
Mechanical manifestation of human cardiovascular dynamics. J.Kříž, P.Šeba Department of physics,University of Hradec Kralove and K.Martiník, J. Šťásek Faculty of Medicine , Charles Un iversity. QC workshop “Spectra, Algorithms and Data Analysis“ February 28, 2006. Program.

E N D
Mechanical manifestation of human cardiovascular dynamics J.Kříž, P.Šeba Department of physics,University of Hradec Kralove and K.Martiník, J. Šťásek Faculty of Medicine, Charles University QC workshop “Spectra, Algorithms and Data Analysis“ February 28, 2006
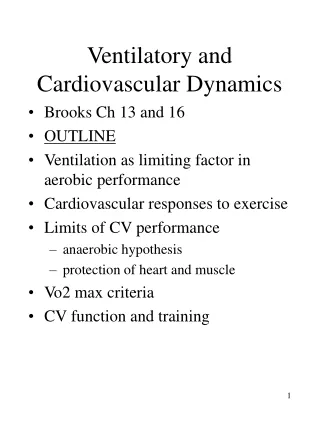
Program • What is a force plate? • How to study cardiovascular system using force plate? • Differential geometry – method of data analysis • Results • Cardiac cycle • Comparing results (cardiac catetherization) • Interpretation • Conclusions
Force plate Measured are the three force and three moment components, i.e. a six dimensional multivariate time series
Force plate only five independent channels Usual choice: force components + COP
Experiment Using the force plate and a special bed we measured the force plate output and the ECG signal on 20 healthy adults. In three cases we measured also the heart sounds. In such a way we obtained a 7 or 8 dimensional time series. The used sampling rate was 1000 Hz.The measurements lasted 8 minutes.
Hypothesis For a reclining subject the motion of the internal masses withinthe body has a crucial effect. Measured ground reaction forces contain information on the blood mass transient flow at each heartbeat and on the movement of the heart itself. (There are also other sources of the internal mass motion that cannot be suppressed, like the stomach activity etc, but they are much slower and do not display a periodic-likepattern.)
Method od data analysis Multivariate signal –process:multidimensional time-parameterized curve. Measured channels:projectionsof the curve to given axes. Example: changing the position of an electrode within EEG measurement changes the measured voltage. The measured process remains unchanged. Measured forces and moments (projections) depend on the position of the pacient on the bed and on the position of the heart inside the body. Characterizing the curve:geometrical invariants.
Geometrical invariants of a curve c: [a,b]-> Rn… Cn([a,b]) – mapping, such that Length of a curve Curvatures: The main message of the differential geometry: It is more natural to describe local properties of the curve in terms of a local reference system than using a global one like the euclidean coordinates.
Frenet frame Frenet frame is a moving reference frame of northonormal vectors ei(t) which are used to describe a curve locally at each point c(t). To see a “Frenet frame” animation click here Assume that are linearly independent
Geometrical invariants: curvatures • The Frenet Frame is the family of orthonormal vectors • called Frenet vectors. They are constructed from the derivates of c(t) using the Gram-Schmidt orthogonalization algorithm with • The real valued functions are called generalized curvatures and are defined as
The simplest cases 2 – dimensional curve …tangent, normal …curvature 3 – dimensional curve …curvature …torsion
Frenet – Serret formulae Relation between the local reference frame and its changes Curvatures are invariant under reparametrization and Eucleidian transformations! Therefore they are geometric properties of the curve. Main theorem of curve theory
Averaging The 5 curvatures were evaluated from 6 force plate signals. Starting point of the cardiac cycle: QRS complex of ECG. Length of the cycle: approximately 1000 ms R-wave P-wave (systola of atria) T-wave (repolarization) Q -wave S-wave QRS complex (systola of ventricles) The mean over cardiac cycles was taken. Length of the cycle: approximately 1000 ms
The question of interpretetion The curvature maxima correspond to sudden changes of the curve, i.e. to rapid changes in the direction of the motion of internal masses within the body. The curvature maxima are associated with significant mechanical events, e.g. rapid heart expand/contract movements, opening/closure of the valves, arriving of the pulse wave to various aortic branchings,...
Cardiac cycle Total blood circulation: Veins right atrium right ventricle pulmonary artery lungs pulmonary vein left atrium left ventricle aorta branching to capillares veins
Pressure wave propagation along aorta Ejected blood propagets in the form of the pressure wave
Pressure wave propagation along aorta On branching places of large arteries the pulse wave is scattered andthe subsequent elastic recoil contribute to the force changes measured by the plate. A similar recoil is expected also when the artery changes its direction (like for instance in the aortic arch).
Aorta and major branchings Aortic arch Mesentric artery Diaphragm Coeliac artery Renal arteries Abdominal bifurcation Iliac arteries
Cardiac Catheterization • involves passing a catheter (= a thin flexible tube) from the groin or the arm into the heart • produces angiograms (x-ray images) • can measure pressures in the left ventricle and the aorta
Cardiac Catheterization For comparism we measured three volunteers on the force plate in the same day as they were catheterized.
Pressures inside the Heart – catheterization measurement ECG Aortic pressure (aortal valve) AVC Ventricular pressure AVO
Pressures inside the Heart – catheterization measurement ECG Aortic pressure (abdominal bifurcation) Ventricular pressure
Pressures in aorta Aortic valve Aortic arch
Pressures in aorta Diaphragm Renal arteries
Pressures in aorta Abdominal bifurcation Arteria femoralis
Conclusions • What is it good for? • Measuring the pressure wave velocity in large arteries • Observing pathological reflections (recoils) • Testing the effect of medicaments on the aortal wall properties • Testing the pressure changes in abdominal aorta in pregnant women • etc.and all this fully noninvasively. Cooperation of the patient is not needed
Pressure wave velocity Depends on the elasticity of the arterial wall and on the arterial pressure.