Download
1 / 14
140 likes | 253 Vues
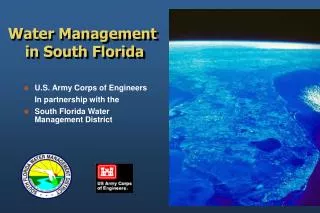
S O U T H F L O R I D A W A T E R M A N A G E M E N T D I S T R I C T. Water Management In South Florida: Agency Reporting. Garth W. Redfield, Ph.D. Chief Scientist, Water Quality Bureau South Florida Water Management District, West Palm Beach, FL USA.

E N D
S O U T H F L O R I D A W A T E R M A N A G E M E N T D I S T R I C T Water Management In South Florida: Agency Reporting Garth W. Redfield, Ph.D. Chief Scientist, Water Quality Bureau South Florida Water Management District, West Palm Beach, FL USA
Overview of Regional Environmental MonitoringHydro-Meteorological andWater Chemistry Data Collection • Data are essential for water management, water quality compliance, environmental research and water resource modeling. • South Florida Water Management District has one of largest environmental databases in the world, DBhydro. • Data stream from field to database has to be well polished.
SFWMD EnvironmentalMonitoring Program + + = Hydrometeorology Water Quality Biology Environmental Monitoring SCADA & HydroData Management EnvironmentalResource Assessment Watershed & CERP / RECOVER • 3,200 Sensors: • Flow • Stage • Groundwater levels • Weather • 1,995 Stations • = 35,600 Events: • Nutrients • Physical Parameters • Inorganics • Pesticides • Mercury (ultra-trace) • Regional: • SAV • Wading birds • Periphyton • Vegetation • Fish • Invertebrates TotalProjected Cost Geotechnical $18 Million $12 Million $23 Million + + = $53 Million
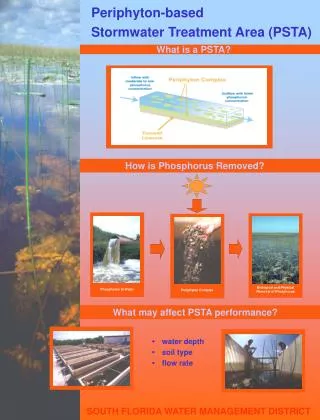
Environmental Monitoring forWater Chemistry • Water quality evaluation requires water quantity and quality • District’s lab and contract labs do common water chemistry analyses • Phosphorus, nitrogen, sulfur • pH, conductivity, alkalinity, chloride • Field measurements: pH, conductivity, temperature, turbidity and oxygen • Chapter 3 of SFER provides updated water quality summary for the Everglades
Regional Environmental MonitoringHydro-Meteorological andWater Chemistry Data Collection • What do we do with all this wonderful data? • Manage water movement • Treat water quality • Monitor resource status and permit compliance • Modeling for mission planning and management • South Florida is data rich and information poor!!
Information Demands from Environmental Monitoring Regulatory and Operational Requirements are Common Drivers Water quality compliance via permits Responsibility for water supply and flood control Water management operations
Example: Water quality standards -Working with America’s Clean Water Act Designated Use Water quality criteria Numerical or narrative criteria statement identifying maximum concentrations of various pollutants which would not interfere with the designated use • Intended beneficial use of a waterbody • Classes: water supply, industrial, recreational, agricultural, fish & wildlife
Data is Critical to State leadershipin Standard Setting • Clean Water Act empowers states to: • Set designated uses • Establish criteria • Monitor for impairment and compliance • Develop plans for compliance • All require high quality monitoring information!
South Florida Environmental ReportBackground on the Report and the Reporting Process The report has developed over more than a decade and has proven to be an effective means for publishing agency data and information. The reporting process is widely applicable and efficient.
SFER Development • The Everglades Forever Act requires reporting on: • Everglades water quality; Source controls; Research and • Stormwater Treatment Areas and other topics • Reporting areas were added to complete coverage for the region and to fulfill legislative requirements • Volume I summarizes annual monitoring and research for Everglades Forever Act and on the Lake, River and Northern Everglades
SFERExpansion • Volume II is eight reports done statewide (e.g., Capital Improvement Plan; Florida Forever Work Plan) • The reporting process was made a requirement for other water management districts • Volume III does permit reports for the District, can expand for new projects and permits • All reports in one location with a standardized format and editorial process • Together, the SFER consolidates over 75 individual reports into a single publication completed March 1 each year and delivered to the State government
Peer-Review Process – Volume I A Public Review Process • Draft Volume I on-line with a public Web Board for comments • Four experts constitute qualified and independent review Panel • Panel is assigned chapters for technical or accountability review • Final comments and recommendations on web • A Governing Board presentation highlights unresolved issues identified in the Panel’s final comments
General Questions for Panel • Technical Review: • Is the report a defensible scientific account of data and findings supported by the ‘best available information’? • Accountability Review: • Is the Report a logical tracking of data and findings that is complete and appropriate? Panel or public can comment substantively on any aspect of the Report
Advantages Consolidated Reporting • Together, the SFER consolidates over 75 reports into a single publication once each year • Peer review exemplifies transparent government and continuous improvement • Editorial process maintains quality & consistency • Annual reporting provides reliable information • Consolidation is efficient for authors & clients • Executive Summary is for a broad audience March 1, 2014, the ~3000page report is published on the web (www.sfwmd.gov/sfer)