Download
1 / 42
420 likes | 605 Vues
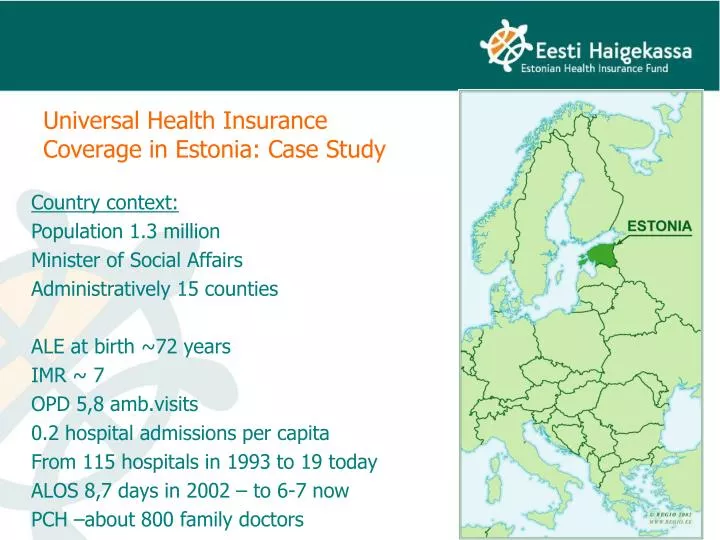
Universal Health Insurance Coverage in Estonia: Case Study. Country context: Population 1.3 million Minister of Social Affairs Administratively 15 counties ALE at birth ~72 years IMR ~ 7 OPD 5,8 amb.visits 0.2 hospital admissions per capita

E N D
Universal Health Insurance Coverage in Estonia: Case Study • Country context: • Population 1.3 million • Minister of Social Affairs • Administratively 15 counties • ALE at birth~72 years • IMR ~ 7 • OPD 5,8 amb.visits • 0.2 hospital admissions per capita • From 115 hospitals in 1993 to 19 today • ALOS 8,7 days in 2002 – to 6-7 now • PCH –about 800 family doctors
Health Care Expenditure in 20006,0 % GDP - 241 EURO per person
Finance - from budget to earmarked tax in 1992 • Health Insurance Law in force since 1992 • Financed: 13 % earmarked health insurance tax on salaries paid by employers • Collected by Tax Agency from 1999 • Coverage: 93% of population • Administration by Health Insurance Fund (EHIF)
Earmarked health insurance tax- stability in revenue in Estonia
Primary Care from 1998 - separation from specialists and more revenues to primary level • Private family practitioners • 1500 - 2300 registered people/ FP • Overall need 810 FP / 562 in 2001 • Health insurance financing • weighted capitation • fee-for-service • basic allowance • bonuses • Gatekeeping for referrals to specialist care
Paying hospitals in Estonia:moving towards needs based planning and case-mix systems Toomas Palu Sr. Health Specialist, World Bank Ex-Member of Management Board Estonian Health Insurance Fund (EHIF)
Specialist Care • Hospitals mostly publicly owned, working under private law • Foundations • Joint-stock companies • EHIF contracts with centers and hospitals • Payment mostly fee-for-service to the limit of the contract – now DRGs • Block-contracts have evolved into very detailed contracts, specifying patient numbers and case-costs per speciality
Needs assessment and contract planning • Analyze service utilisation variation among 7 population pools as proxies for need
Needs assessment and contract planning in EHIF • Analyze service utilisation variation among 7 population pools as a proxy for need • Utilisation of data warehouse concept • Data warehouse is an IT tool for regular extraction of data from the EHIF database • Verify analysis with GPs to separate supplyinduced demand from medical need as much as possible • Plan cost-and-volume contracts according to needs assessment results
Needs assessment: aggregate population based utilisation rates
Obstetrics and gynaecology: small area variation in service use
Monitoring hospital waiting times • Standard waiting times reporting introduced in 2002 • reported by hospitals, breakdown by specialty and by EHIF population pool • standardised for population (per 100 000 people) • some action must be taken if waiting times are longer than 6 months
Prioritizing queues • Application of prioritization protocols • joint replacement and cataract surgery queues • evaluate need, e.g. • - physical impairment (visual aquity, functional mobility) • - pain • - ability to work, give care to dependents, live independently • protocols based on New Zealand experience • People with higher needs needs are treated faster
Priority criteria for major joint replacement • Pain 40% • appearance and severity • Functional activity 20% • walking and other function limitations • Movement and deformity 20% • pain on examination and other abnormal finding • Other factors 20% • Multiple joint involvement and ability to work, give care to dependents of live independently
Conclusions on needs assessment • Utilisation and queues are notperfect indicators for needs assessment • depend also on supply and other factors • To improve assessment, initial results are reviewed by family physicians (“corporate view”) • More thorough research is needed into different population based determinants of morbidity and mortality as well into analysis of cost-efficiency for the best health service response to needs • Adjustments in regional allocation formula possible
Case based hospital financing: introduction of NordDRGs in 2003 • Nordic DRGs (Diagnosis Related Groups) • Used by Nordic countries • 498 DRGs • Based on ICD-10 and NOMESCO-NCSP classification • Why NordDRGs? • Number of cases too small to develop Estonian own unique system • Currently available data fits the best with the NordDRG locic, e.g. AR-DRG (Australia) requires detailed information on co-morbidities • Nordic countries are near-by, technical support available
Estonian DRG TOP 10 based on case cost* % of DRG Name Cost (EEK) cost 373 Normal delivery without complicatoins 2,95% 45 231 195 430 Psychoses 2,88% 44 184 304 105 Procedures with heart valves w/out catheterisation 2,80% 42 870 424 483 Tracheostomy, expt face, neck and lower jaw diagnoses 2,69% 41 219 090 112 Percutaneous cardio-vascular diagnoses 2,65% 40 598 849 Hip and femur procedures, patient age > 17, without 211 1,88% 28 778 315 complications 39 Procedures on lens, w/ or w/out vitrectomy 1,64% 25 149 968 140 Stenocardia ( angina pectoris ) 1,64% 25 071 615 14 Certain cererbrovascular diseases, expt transitory ishaemia 1,52% 23 264 651 Procedures on uterus and ovaries, nonmalignant tumors 359 1,52% 23 195 885 without complications Total 1 533 194 564 * Preliminary results
Estonian DRG TOP 10 based on number of cases* % of Number DRG Name cases of cases Other factors influencing health status 467 4,53% 14 398 Abortion by cervical dilatation, currettage, aspiration currettage or 381 3,41% 10 831 hysterectomy Normal delivery without complications 373 3,13% 9 950 High blood pressure 134 1,77% 5 629 Slight skin disorders w/out complications 284 1,70% 5 383 Psychoses 430 1,68% 5 348 Intraocular procedures, expt iris, retina, lens 42 1,62% 5 157 Medical back problems 243 1,62% 5 143 Otitis media, age 0-17, w/out complications 70B 1,59% 5 047 Dilatation and curretage, conisation, nonmalignant tumour 364 1,57% 5 000 Kokku 317 526 * Preliminary results
Reimbursing Pharmaceuticals: Estonian case Toomas Palu Sr. Health Specialist, World Bank Ex-Executive, Estonian Health Insurance Fund
EHIF Expenditures on Health Services, Pharmaceuticals and Sickness Benefits
Pharmaceuticals´ reimbursement problems • Estonia has very liberal pharmaceuticals pricing policy • Prices determined by producers • Wholesale and retail margins allowed by state guarantee profits • Retail sector interested in selling expensive drugs • Estonia has liberal pharmaceuticals reimbursement policy • All prescriptions are reimbursed for at least 50% • EHIF compensates regardless of price (cost of just brandname among c/v drugs is EEK 100-150 mill annually) • Adding new drugs to reimbursement list without considerations on expenditures and cost-effectiveness • Doctors and patients are not sensitive to price, make decisions regardless of price • Large practice variations among doctors • Why?
Pharmaceuticals´ reimbursement problems (II) • Generic substitution not regulated • doctors do not have to prescribe generic compound names • pharmacists - no right nor obligation for generic substitution • Need to increase prescription volumes • chronic patients do not take drugs regularly
EHIF strategy to control pharmaceutical expenditure growths • Limit reimbursement • Reference prices – based only on active ingredient • Price setting through price agreements • Analysis of doctors prescription behaviour and feedback • Possible pharmaceuticals budget holding - No • Agreements with doctors about priorities and proportions - No • Review of wholesale and retail margins • Capping pharmaceuticals reimbursement budget to 20% of that for health services - unrealistic
EHIF expenditures on cardio-vascular drugs in2001 – EEK 267 M
EHIF expenditure and expected impact of reference prices; 2001 data
Drug prescription behaviour feedback to doctors • Goals • analyse prescription behaviour variations • influence behaviour through peer pressure • variations should decrease • started March 2001 • Period - quarterly
Variation analysis of prescription practices by family doctors. 2001 I kvartal IV kvartal
Cardiologist prescriptions for high blood pressure, cost per person in 2001 (n=148)
Antibiotics’ prescriptions by family doctors with influenza diagnosis. January 2001.
Purchasing and Quality • EHIF commissions guidelines and medical audits • Contracts mandate using approved guidelines • Benchmarking on utilization and quality indicators – monopsonic purchasr • Standard quality reporting • Monitoring of waiting time and population perception