Download
1 / 4
40 likes | 220 Vues
Data collected at GSECARS, APS 13-ID-E with ~2 x 2 micron X-ray beam at 18 keV. 1 x 1 mm area, 2 x 2 m m pixels, 10 ms per pixel (~45 minute acquisition). Using XIA xMAP (1 m s peaking time) and Xspress3 electronics.

E N D
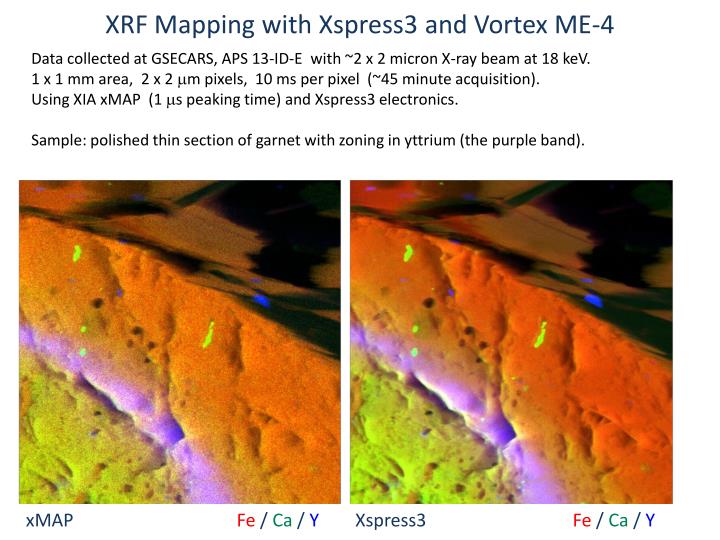
Data collected at GSECARS, APS 13-ID-E with ~2 x 2 micron X-ray beam at 18 keV. 1 x 1 mm area, 2 x 2 mm pixels, 10 ms per pixel (~45 minute acquisition). Using XIA xMAP (1 ms peaking time) and Xspress3 electronics. Sample: polished thin section of garnet with zoning in yttrium (thepurple band). XRF Mapping with Xspress3 and Vortex ME-4 xMAP Fe / Ca / Y Xspress3 Fe / Ca / Y
sample–detector distance ~ 40 mm for Xspress3, 65 mm for xMAP (to avoid saturation) Y intensity map (blue = high intensity) Signal-to-noise and image contrast are noticeably improved with Xspress3. XRF Mapping with Xspress3 and Vortex ME-4 xMAP Xspress3
Saturation effects: xMAP Y intensity map (blue = high intensity) Maps are built by scanning rows right-to-left and then left-to-right. At high count rate, the xMAP shows a zig-zag pattern. Y map detail: zircon grain (upper left) XRF Mapping with Xspress3 and Vortex ME-4 XRF extracted from zircon grain (574 pixels, 5.7 sec). Count rates (sum of 4 elements, DT corrected): 0.456 MHz total, 0.106 MHz Fe Ka, 0.211 MHz Zr Ka xMAP
Saturation effects: Xspress3 Y intensity map (blue = high intensity) At very high count rate (10x that of xMAP), the Xspress3 shows some peak broadening, but no obvious problems in the image. Y map detail: zircon grain (upper left) XRF Mapping with Xspress3 and Vortex ME-4 XRF extracted from zircon grain (574 pixels, 5.7 sec). Count rates (sum of 4 elements, DT corrected): 5.538 MHz total, 1.083 MHz Fe Ka, 2.194 MHz Zr Ka Xspress3