Download
1 / 13
170 likes | 416 Vues
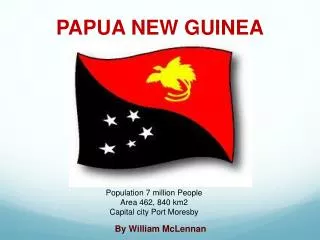
Application of GIS for Seismic Observation in Papua New Guinea. Eric Buri Port Moresby Geophysical Observatory Geohazards Division Department of Mineral Policy & Geohazards Management. DMPGM Mission & Vision.

E N D
Application of GIS for Seismic Observation in Papua New Guinea Eric Buri Port Moresby Geophysical Observatory Geohazards Division Department of Mineral Policy & Geohazards Management
DMPGM Mission & Vision • To improve the quality of life and safety of all people in PNG through effective Mineral Policies and reduction of Geological Risks • To establish a state of the art Geohazards Management System to minimize property damage and loss of life
Seismicity of the Earth 1900-2012(M7.5+) New Guinea Region
Use of GIS in Enhancing Operation • Catogorising earthquakes appropriately • Make it easier to be understood by the general public when in graphic format • Useful for planning purposes • Useful for public awareness on earthquakes and tsunamis
New Guinea Region Seismicity • Seismicity of the PNG region in the period 1900 to 2012. • Black circle denote depth range of 400km and more • green stars denote depths of 250-399km • yellow diamonds denote depth range 100-249km • blue triangles denote 40-99km • Red circles denote shallow depths 0-39km
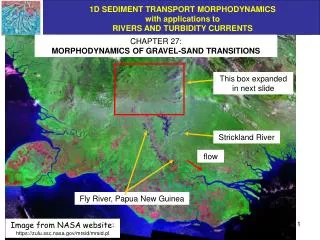
Seismicity and main tectonic features Figure 1a. Tectonic configuration and seismicity of PNG. Seismological studies are revealing the geological structure and dynamics of the PNG region on both large and smaller scales. The boundaries of the lithospheric plates in the PNG region are becoming clearer, although some boundaries remain uncertain. The nature of the processes at the plate boundaries are also being revealed by seismological studies.
Fault zones in the PNG • Progressive study of EQ helps to: • define crustal structure • -PNG region gets squeezed by the WSW movement of the Pacific plate interacting with the NNE movement of the Indo-Australian plate. With the help of processed seismic data (such as FMS) different types of seismic faults can be identified. • Divergent fault • Convergent fault • Normal fault • Direction of plate motion (Johnson, R. W., (2000))
Seismic Zones for PNG Region Seismic studies help us • Define seismic zones in PNG • Establish PNG Building Code. • Propose changes in the design and construction of the actual structure. Seismic zones defining PNG Building code. The numbers represent the level of risk from low (4) to high (1), with the likely threat of corresponding surface wave magnitudes for the zones.
EQ Occurrences PROBABILITEIS Studies have been conducted to determine return periods and probabilities of occurrence of large earthquakes. • The calculation are performed based on • Bed rock site condition • Site condition inferred from Vs30 map for East New Britain region.
Generally, the hazard level is higher in the southeast part of the region. This is mainly due to the geometry & distance to the subduction zone interface.
Economic benefits to the State • Avoidance of property damage and deaths caused by geological hazards through improved safety and quality of life of geohazards-threatened communities • Increases in land values because of better planning for well understood hazards specific for those particular geological environments • Integrated benefits from measures to mitigate geological hazards far outweighs the cost of maintaining geohazards monitoring activities
Conclusion GIS Seismic data collected can help us ; • Identify different types of fault s • categorize region into different seismic zones • To define building code • to promptly provide technical information and advice to the State, disaster authorities, line agencies and the general public • Help us to identify location that are more stable from effects earthquake shaking for major government infrastructure development • Make appropriate geological hazards policy