Download
1 / 23
230 likes | 366 Vues
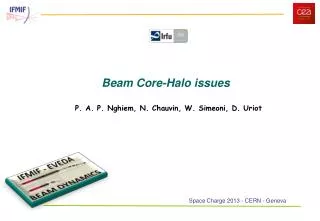
Beam Halo Monitoring using Optical Diagnostics. Hao Zhang University of Maryland/University of Liverpool/Cockcroft Institute. Outline. Introduction Motivation to Study Beam Halo Method Adaptive Method Using Digital Micro-mirror Device Experiment

E N D
Beam Halo Monitoring using Optical Diagnostics Hao Zhang University of Maryland/University of Liverpool/Cockcroft Institute
Outline • Introduction • Motivation to Study Beam Halo • Method • Adaptive Method Using Digital Micro-mirror Device • Experiment • University of Maryland Electron Ring (UMER) • JLAB FEL • Injection of SPEAR3 storage ring
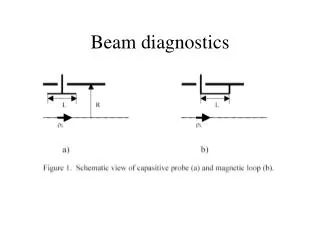
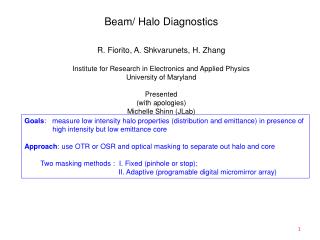
Motivation for Beam Halo Studies Halo can be regarded as small fraction of particles out a well defined beam core. • Beam Halo has many negative effects • Nuclear Activation of The Transport Channel • Emittance Growth • Emission of Secondary Electrons • Increasing Noise in The Detectors Halo Picture credit: Kishek, Stratakis
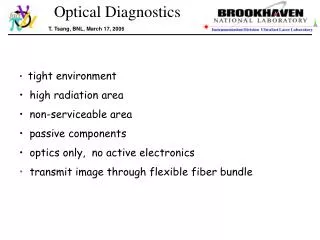
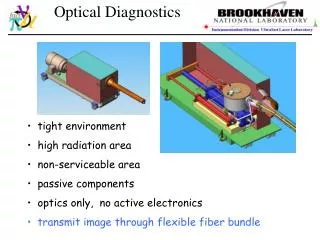
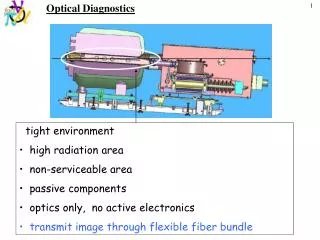
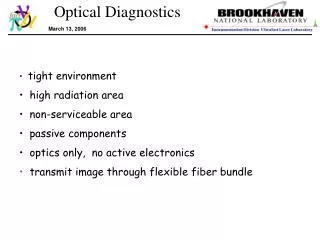
Imaging Halos Problems: 1) Need High Dynamic Range ( DR >105 - 106) 2) Core Saturation with conventional CCD’s: blooming, possible damage 3) Diffraction and scattering associated with high core intensity contaminate halo 4) Adaptability when the beam core shape change. Solutions: 1) Passive spatial filtering, e.g. solar corography applied to beam imaging by T. Mitsuhashi of KEK DR = 106-107achieved 2) Spectra-Cam CID , DR ~ 106measured with laser by J. Egberts, C. Welsch, T. Lefevre and E. Bravin 3) Adaptive Mask based on Digital Micromirror Array; DR ~ 105 measured with laser and 8 bit CCD camera by Egberts, Welsch
120 Digital Micro-mirror arrayDevice* *DLPTM TexasInstruments Inc. Micro-mirror architecture: • Mirror size: 13.68 um x 13.68 um • Resolution: 1024 X 768 pixels 450
Adaptive Method for Halo Measurement Source Source Mirror Mirror L1 L1 Computer Computer L2 L2 L3 L3 L4 L4 Halo Light Core Light Image 2 Camera Sensor Camera Sensor 32mm Mask Image 1 DMD DMD
Quadrupole Screen UMER Experiment
Testing filtering ability of DMD Beam on, DMD all on Beam on, DMD all off 32mm Average readout of the core region 49616 21
Dynamic Range Test of DMD with intense beam and circular mask* 32mm Integration Frames: 20 275 1000 Integration Frames: 2000 3000
Circular Mask Data line profile 32mm 1 0
Demonstration of Adaptive Masking on UMER Quadrupole Current IQ 82.9%IQ 66.3%IQ 49.7%IQ 32mm (a) y x 70 45 45 60 (b) 280 640 660 250
Halo Experiment with OSR in JLab FEL Bending Magnet Beam pipe
Masking OSR Image of JLAB FEL Beam y 1 3 2 4 mm X 4 mm 1.2 s No mask Integration Time Mask Level 2.2 s 25000 35000 1.5 s 6 5 4 14 s 4 s 15000 80 s 2000 5000
Measurement of Dynamic Range for OSR DMD System 100 Normalized Counts 10-2 10-4 10-6 pixel
DMA/DMD Configuration M=0.14 M=4 M=1
More Details… Mechanical Shutter (5ms) Filter wheel f=+125mm f=+100mm, 2” dia 1000x1000 DMD Scheinflug angle Diffraction pattern
Data acquisition Injector Gate Injected beam READOUT BTS M3=1 f=+100mm PiMax 24° DMD Stored beam SPEAR3 f=+125mm Filter wheel M2=3.55 M = M1*M2*M3 = 0.4 Aperture & Cold finger OSR Source M1=0.138 9.6m 7.14m f=+2m
PSF measurement of the stored beam • 2 ms shutter mode • Increase the mask size by changing the intensity threshold level • ND filter from ND =5 to ND = 0 No Mask 18 mm ND 3 ND 4 ND 5 Mask ND 0 ND 1 ND 2
Injected 18 mm Stored beam beam Current /bunch 0.42 mA 1.52 mA 3.05 mA 6.11 mA Injected beam with presence of stored beam with different currents (a) (b)
Conclusion • Applied a adaptive optics to detect small image signals from either beam halo or Injected beam compared with beam core or stored beam. • Achieve a high dynamic range with this method.
Discussion • How can we apply this method to other existing machines? • What is the limitation of dynamic range? • For Proton machine, since the beam is destructive, are there any usable screens?