Download
1 / 39
400 likes | 573 Vues
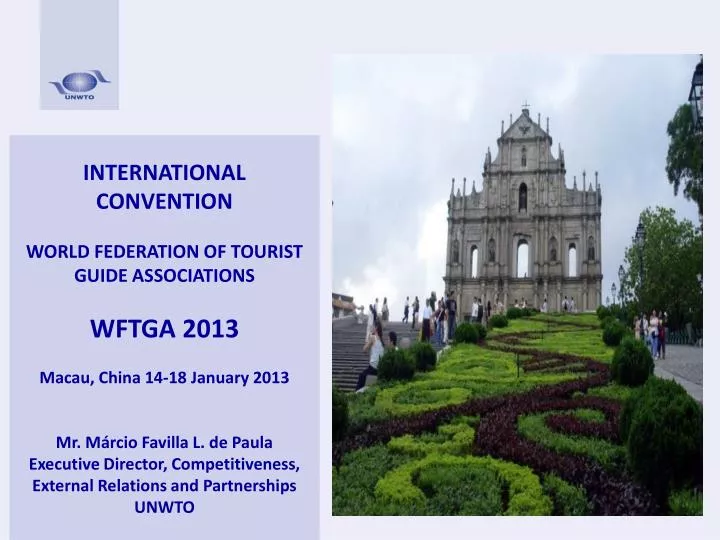
INTERNATIONAL CONVENTION WORLD FEDERATION OF TOURIST GUIDE ASSOCIATIONS WFTGA 2013 Macau, China 14-18 January 2013 Mr. Márcio Favilla L. de Paula Executive Director, Competitiveness, External Relations and Partnerships UNWTO. Results 2011 International Tourist Arrivals 990 million

E N D
INTERNATIONAL CONVENTION WORLD FEDERATION OF TOURIST GUIDE ASSOCIATIONS WFTGA 2013 Macau, China 14-18 January 2013 Mr. Márcio Favilla L. de Paula Executive Director, Competitiveness, External Relations and Partnerships UNWTO
Results 2011 International Tourist Arrivals 990 million +5.0% International Tourism Receipts (BOP Travel) US$ 1,035 billion (euro 740 bn) +3.9% (real terms) + International passenger transport (BOP Transport, passenger) US$ 203 billion (euro 144 bn) www.unwto.org/facts
Inbound tourism: World Source: World Tourism Organization (UNWTO)
International Tourism Arrivals and Receipts, World growth in receipts follows growth in arrivals closely ‘Great recession’: receipts more affected and slower to recover 11S, SARS, economic downturn: receipts more affected Asian financial and economic crisis: receipts grew slower Source: World Tourism Organization (UNWTO)
INTERNATIONAL TOURISM 2011* International tourist arrivals and receipts and market share (%) Europe ITA: 509 million (51%) ITR: US$ 464 billion (45%) Middle East ITA: 56 million (6%) ITR: US$ 47 bn (5%) Asia and the Pacific ITA: 218 million (22%) ITR: US$ 291 billion (28%) Americas ITA: 157 million (16%) ITR: US$ 199 billion (19%) Africa ITA: 50 million (5%) ITR:US$ 33 billion (3%) Source: World Tourism Organization (UNWTO)
Results 2012 www.unwto.org/facts
International tourism continues to grow strongly +2.1% -3.9% +5.0% +4.1% +6.6%
+7.3% +1.1% -1.6% +13.2% +6.4%
Emerging destinations suffered less in the crisis and recovered quicker
International tourism: projection full year 2012 Source: World Tourism Organization (UNWTO)
Outlook: World Forecast 2012: 3% to 4% 2013: 2% to 4% change (%) Source: World Tourism Organization (UNWTO)
International arrivals to reach 1.4 billion in 2020 and 1.8 billion by 2030 Averageannualgrowth 2010-2030: +3.3% + 43 million 1.8 bn 1.4 bn 1 bn
Growth in international tourism will continue, but at a more moderate pace Average annual growth 2010 – 2030 : 3.3% 2010 - 2020 2020 - 2030 3.8 % 2.9% Average annual growth Average annual growth 1995 – 2010: 3.9% 1980 – 1995: 4.4%
International tourist arrivals to increase by 43 million a year on average Average growth 2010 – 2030 : +43 mn 2020 - 2030 2010 - 2020 +42 mn + 45 mn Average growth Average growth 1980 – 1995: +17 mn 1995 – 2010: +28 mn
Emerging economies destinations to surpass advanced destinations by 2015 1,037 mn 552 mn 523 mn 772 mn 540 mn 457 mn
Asia and the Pacific, the Middle East and Africa to increase their shares 1980 (277 mn) 2010 (940 mn) 2030 (1.8 bn)
Asia and the Pacific will also be the outbound region that grows most 832mn 509mn 541mn 205mn 265 mn 160 mn 81mn 37mn 90mn 30mn
Asia and the Pacific will gain most of the new arrivals 744 mn 475 mn 535 mn 248 mn 204 mn 150 mn 61 mn 149 mn 134 mn 50 mn
Emerging markets
Growth: Driven by emerging destinations Source: World Tourism Organization (UNWTO)
Growth: Driven by emerging destinations (share) Source: World Tourism Organization (UNWTO)
Most arrivals within own region Source: World Tourism Organization (UNWTO)
Average annual growth: 2000-2011* Source: World Tourism Organization (UNWTO)
Emerging markets characteristics • Sizeable population → still limited number taking part in international tourism → huge growth potential • Economies rapid economic growth → disposable incomes increase • A relative big share of this increase will be spent on tourism (domestic as well as international) • Emerging middle classes: • Growing proportion of population able to take part and taking part in tourism • Increasing frequency of existing travelers • Increased competition →diversification strategies
World’s Top Economies in 2030: BRICS on the spot Country GDP 2030 (USD trn) Country GDP 2010 (USD trn) • USA • China • Japan • Germany • France • UK • Italy • Brazil • Russia • Canada • India • Spain • Australia • Mexico • Korea (ROK) 14.6 5.6 4.8 3.6 2.9 2.6 2.3 2.0 1.7 1.6 1.6 1.5 1.2 1.1 1.0 • China • USA • India • Brazil • Japan • Russia • Germany • France • UK • Mexico • Italy • Canada • Korea (ROK) • Spain • Australia 31.7 22.9 8.0 5.9 5.9 4.7 4.4 4.2 3.6 3.0 2.9 2.3 2.1 2.0 1.8 Source: IMF Projection in 2010 constant dollars; source: Goldman Sachs
Fast-growing emerging destinations Inbound tourism 2000 - 2011 0,8
Emerging markets increasing expenditure abroadInternational tourism expenditure 2000 - 2011 3 2 1 2 3 4 5 7 4 9 5 12 18 15 17 7 23 12 15 18 26 32
International tourism expenditure in major outbound markets: BRICs are hot C B R I
China Outbound Travel Market • China is the most populated country in the world and the world’s second largest economy. China is also one of the fastest growing travel markets in the world, both in terms of international visitor arrivals and expenditure abroad • China is the third largest spender in the world after Germany (US$ 86 billion) and the United States (US$ 79 billion). Chinese travellers spent US$ 73 billion in 2011, a more than three-fold increase from 2005, when expenditure was US$ 22 billion. • Thanks to rising disposable incomes, rapid urbanization and relaxations of restrictions on foreign travel, outbound trips from China have grown an average 19% a year since 2000. Chinese had taken 34.5 million trips abroad (2006). By 2011, this figure had risen to over 70 million, and continues to increase steadily. Source: World Tourism Organization (UNWTO)
UNWTO reports on Outbound Markets • The Indian Outbound Travel Market (2007) • The Chinese Outbound Travel Market (2008) (new update forthcoming, 2012) • The Russian Outbound Travel Market (2009) • The Middle East Outbound Travel Market (2012) • The US Outbound Travel Market (2013) • The Latin American Outbound Travel Market (2013) • The Brazil Outbound Market (2013)
Tourism in the global agenda • G20 recognizes for the first time Travel and Tourism as a vehicle for job creation, economic growth and development, and commits to work on travel facilitation • Rio+20 recognizes the significant contribution of sustainable tourism to the three dimensions of sustainable development, its linkages to other sectors and its capacity to create decent jobs and trade opportunities.
Thank you very much for your attention! World Tourism Organization (UNWTO) www.unwto.org