Download
1 / 17
180 likes | 479 Vues
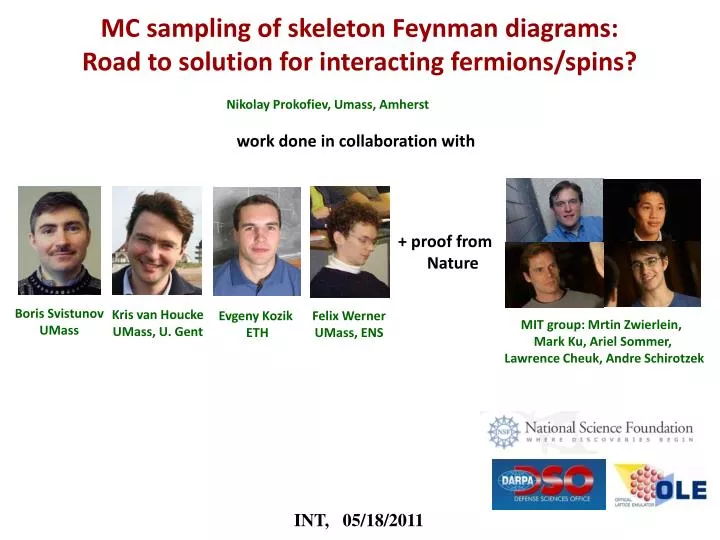
MC sampling of skeleton Feynman diagrams: Road to solution for interacting fermions/spins?. Nikolay Prokofiev, Umass, Amherst. work done in collaboration with . + proof from Nature. Boris Svistunov UMass. Kris van Houcke UMass, U. Gent. Evgeny Kozik ETH. Felix Werner

E N D
MC sampling of skeleton Feynman diagrams: Road to solution for interacting fermions/spins? Nikolay Prokofiev, Umass, Amherst work done in collaboration with + proof from Nature Boris Svistunov UMass Kris van Houcke UMass, U. Gent Evgeny Kozik ETH Felix Werner UMass, ENS MIT group: Mrtin Zwierlein, Mark Ku, Ariel Sommer, Lawrence Cheuk, Andre Schirotzek INT, 05/18/2011
Feynman Diagrams: graphical representation for the high-order perturbation theory Feynman diagrams have become our everyday’s language. “Particle A scatters off particle B by exchanging a particle C … “
Diagrammatic technique: admits partial resummation and self-consistent formulation Calculate irreducible diagrams for , , … to get , , …. from Dyson equations Dyson Equation: Screening: Ladders: (contact potential) More tools: (naturally incorporating Dynamic mean-field theory solutions) Higher “level”: diagrams based on effective objects (ladders), irreducible 3-point vertex …
Feynman Diagrams Physics of strongly correlated many-body systems, i.e. no small parameters: Are they useful in higher orders? And if they are, how one can handle billions of skeleton graphs?
Skeleton diagrams up to high-order: do they make sense for ? NO Dyson: Expansion in powers of g is asymptotic if for some (e.g. complex) g one finds pathological behavior. Electron gas: Bosons: [collapse to infinite density] Math. Statement: # of skeleton graphs asymptotic series with zero conv. radius (n! beats any power) Diverge for large even if are convergent for small . Asymptotic series for with zero convergence radius
Skeleton diagrams up to high-order: do they make sense for ? YES # of graphs is but due to sign-blessing they may compensate each other to accuracy better then leading to finite conv. radius • Dyson: • Does not apply to the resonant Fermi gas and the Fermi-Hubbard model at finite T. • not known if it applies to skeleton graphs which are NOT series in bare : • e.g. the BCS theory answer • (lowest-order diagrams) • - Regularization techniques are available. Divergent series far outside of convergence radius can be re-summed. From strong coupling theories based on one lowest-order diagram To accurate unbiased theories based on billions of diagrams and limit
Re-summation of divergent series with finite convergence radius. Example: бред какойто Gauss Define a function such that: Lindeloef Construct sums and extrapolate to get
Configuration space = (diagram order, topology and types of lines, internal variables) Diagram order MC update MC update Computational complexity is factorial : Diagram topology This is NOT: write diagram after diagram, compute its value, sum
Resonant Fermions: Universal results in the zero-range, , and thermodynamic limit Unitary gas: .
Skeleton graphs based on all ladder diagrams Useful ‘bold’ relations:
resummation and extrapolation for density controls contributing diagram orders
Unitary gas EOS (full story in previous talks) (in the universal & thermodynamic limit with quantifiable error bars) Goulko, Wingate ‘10 (calculated independently and cross-checked for universality)
Critical point from pair distribution function Mean-field behavior: Criticality: from
Burovski et. al ’06, Kozik et. al ‘08 Goulko & Wingate ‘10
Conclusions/perspectives Diag.MC for skeleton graphs works all the way to the critical point Phase diagrams for strongly correlated states can be done, generically Res. Fermions: population imbalance, mass imbalance, etc Fermi-Hubbard model (any filling) Coulomb gas Frustrated magnetism …
Cut one line – interpret the rest as self-energy for this line: