Download
1 / 5
50 likes | 204 Vues
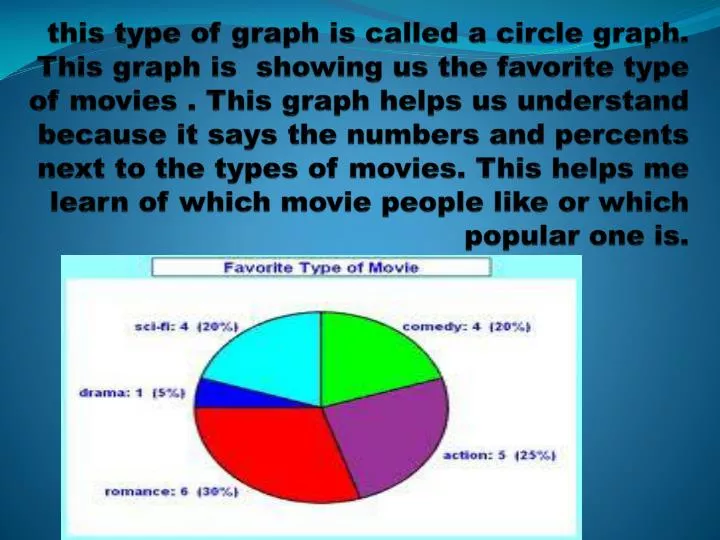
this type of graph is called a circle graph. This graph is showing us the favorite type of movies . This graph helps us understand because it says the numbers and percents next to the types of movies. This helps me learn of which movie people like or which popular one is .

E N D
this type of graph is called a circle graph. This graph is showing us the favorite type of movies . This graph helps us understand because it says the numbers and percents next to the types of movies. This helps me learn of which movie people like or which popular one is.
This is a pictograph. Its shows us The Favorite Pizza Toppings. This helps me learn that how much pizza toppings are sold the most . This helps us learn because of the toppings and of the answer key at the bottom of the picture.
This is a recipe of Boiled Sea Scallops With Sherry its showing how to make it and what materials we need. This is showing fractions for example like in the recipe it says ½ of chives, pounds of scallops and tablespoons of sherry wine. This helps me learn of how much we need of each thing . This helps us learn because of the numbers and how much we need of the product.
This is a bathroom rug. This shows decimals because it has a decimal on with the number. This helps us learn because its easy to know what place is the number and were is the decimal and how much it will cost . This helps me learn of how much its gonna cost or be. $18.97
This is a bar graph. This is showing the different kinds of fruit that kids or people like. This helps me learn because of the labels that are in the graph and that which fruit is popular. This helps us learn because of the labels and which fruit people like.