Download
1 / 19
190 likes | 327 Vues
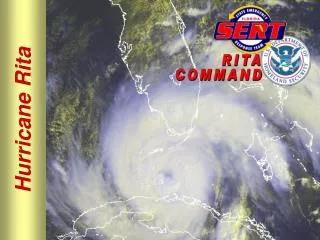
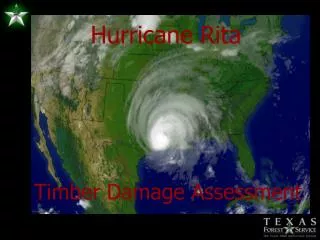
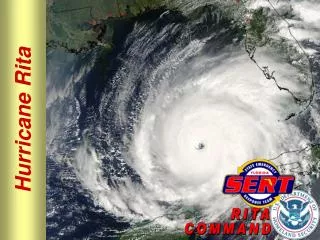
The Performance of Minimet Wind and Temperature Chain Drifters in Hurricane Rita William Scuba and Peter Niiler Scripps Institution of Oceanography La Jolla, California, U.S.A. Buoy’s Deployment Position and Path of Hurricane Rita. System Components.

E N D
The Performance of Minimet Wind and Temperature Chain Drifters in Hurricane Rita William Scuba and Peter Niiler Scripps Institution of Oceanography La Jolla, California, U.S.A.
System Components • Minimet sphere and electronics – Pacific Gyre • Temperature chain components – Clearwater Instruments • Temperature chain construction – Scripps Institution of Oceanography • Parachute and rigging – AERO • Deployment – 53rd “Hurricane Hunters” U.S. Air Force Squadron
Getting the Data Through ARGOS 2005-09-21 19:48:31 6.5 6.7 6.5 6.4 6.4 6.2 5.9 5.1 3.8 2.9 2.4 2005-09-21 20:03:31 0.0 0.0 0.0 0.0 0.0 -0.1 -0.1 -0.2 -0.1 -0.1 0.0 2005-09-21 20:18:31 0.0 0.0 0.0 0.0 0.0 0.0 -0.1 -0.3 -0.1 -0.1 0.0 • 8 Pages used • 1 for SST, atmospheric pressure, wind speed and wind direction • 7 for temperature chain data • 5 hours and 15 minutes of temperature data archived • If measured value is < 2 then 30 is added to temperature value, otherwise, 20 is added to temperature value
Survivability • 2005: 20 of 20 drifters transmitted data through hurricane Rita (Category 5) • All 8 of 8 temperature chains functioned properly • 2004: 35 of 39 drifters transmitted data through hurricane Frances (Category 4) • Only 1 of 8 temperature chains functioned properly • 2003: 8 of 16 drifters transmitted data through hurricane Fabian (Category 4)
Data on the GTS • New GTS templates created • Buoy pressure and SST data where assimilated into the hurricane prediction models in real time • Subsurface temperature not on the GTS right away • Special thank to Mayra, Etienne and Andy for their work on getting the data on the GTS
Summary • Experiment methodology proved successful for obtaining surface and subsurface data in hurricanes • Temperature chain technology tested and proved successful • Wind speed has yet to be examined