Download
1 / 1
10 likes | 117 Vues
Assessing oxygen consumption in an agricultural soil treated with two different wood ashes J. A . Campos 1 , A.I. Gómez 1 , J.A. Amorós 1 , C. Pérez de los Reyes 1 , F.J. García Navarro 1 , M.M. Moreno 1 , A. Acosta 2 , (1) Dpto . Producción Veg. EUITA-UCLM. 13071 Ciudad Real. Spain

E N D
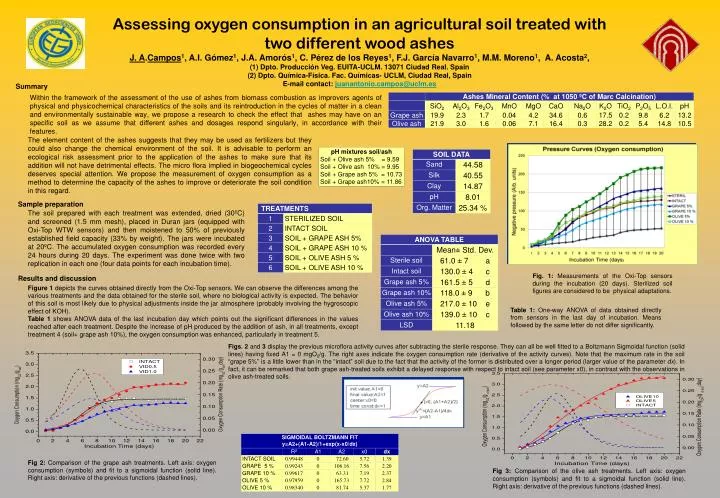
Assessing oxygen consumption in an agricultural soil treated with two different wood ashes J. A.Campos1, A.I. Gómez1, J.A. Amorós1, C. Pérez de los Reyes1, F.J. García Navarro1, M.M. Moreno1, A. Acosta2, (1) Dpto. Producción Veg. EUITA-UCLM. 13071 Ciudad Real. Spain (2) Dpto. Química-Física. Fac. Químicas- UCLM, Ciudad Real, Spain E-mail contact: juanantonio.campos@uclm.es Summary The element content of the ashes suggests that they may be used as fertilizers but they could also change the chemical environment of the soil. It is advisable to perform an ecological risk assessment prior to the application of the ashes to make sure that its addition will not have detrimental effects. The micro flora implied in biogeochemical cycles deserves special attention. We propose the measurement of oxygen consumption as a method to determine the capacity of the ashes to improve or deteriorate the soil condition in this regard. pH mixtures soil/ash Soil + Olive ash 5% = 9.59 Soil + Olive ash 10% = 9.95 Soil + Grape ash 5% = 10.73 Soil + Grape ash10% = 11.86 Sample preparation Within the framework of the assessment of the use of ashes from biomass combustion as improvers agents of physical and physicochemical characteristics of the soils and its reintroduction in the cycles of matter in a clean and environmentally sustainable way, we propose a research to check the effect that ashes may have on an specific soil as we assume that different ashes and dosages respond singularly, in accordance with their features. The soil prepared with each treatment was extended, dried (30ºC) and screened (1.5 mm mesh), placed in Duran jars (equipped with Oxi-Top WTW sensors) and then moistened to 50% of previously established field capacity (33% by weight). The jars were incubated at 20ºC. The accumulated oxygen consumption was recorded every 24 hours during 20 days. The experiment was done twice with two replication in each one (four data points for each incubation time). Fig. 1: Measurements of the Oxi-Top sensors during the incubation (20 days). Sterilized soil figures are considered to be physical adaptations. Results and discussion Figure 1 depicts the curves obtained directly from the Oxi-Top sensors. We can observe the differences among the various treatments and the data obtained for the sterile soil, where no biological activity is expected. The behavior of this soil is most likely due to physical adjustments inside the jar atmosphere (probably involving the hygroscopic effect of KOH). Table 1 shows ANOVA data of the last incubation day which points out the significant differences in the values reached after each treatment. Despite the increase of pH produced by the addition of ash, in all treatments, except treatment 4 (soil+ grape ash 10%), the oxygen consumption was enhanced, particularly in treatment 5. Table 1: One-way ANOVA of data obtained directly from sensors in the last day of incubation. Means followed by the same letter do not differ significantly. Figs. 2 and 3 display the previous microflora activity curves after subtracting the sterile response. They can all be well fitted to a Boltzmann Sigmoidal function (solid lines) having fixed A1 = 0 mgO2/g. The right axes indicate the oxygen consumption rate (derivative of the activity curves). Note that the maximum rate in the soil “grape 5%” is a little lower than in the “intact” soil due to the fact that the activity of the former is distributed over a longer period (larger value of the parameter dx). In fact, it can be remarked that both grape ash-treated soils exhibit a delayed response with respect to intact soil (see parameter x0), in contrast with the observations in olive ash-treated soils. Fig 2: Comparison of the grape ash treatments. Left axis: oxygen consumption (symbols) and fit to a sigmoidal function (solid line). Right axis: derivative of the previous functions (dashed lines). Fig 3:Comparison of the olive ash treatments. Left axis: oxygen consumption (symbols) and fit to a sigmoidal function (solid line). Right axis: derivative of the previous functions (dashed lines).