Download
1 / 14
140 likes | 247 Vues
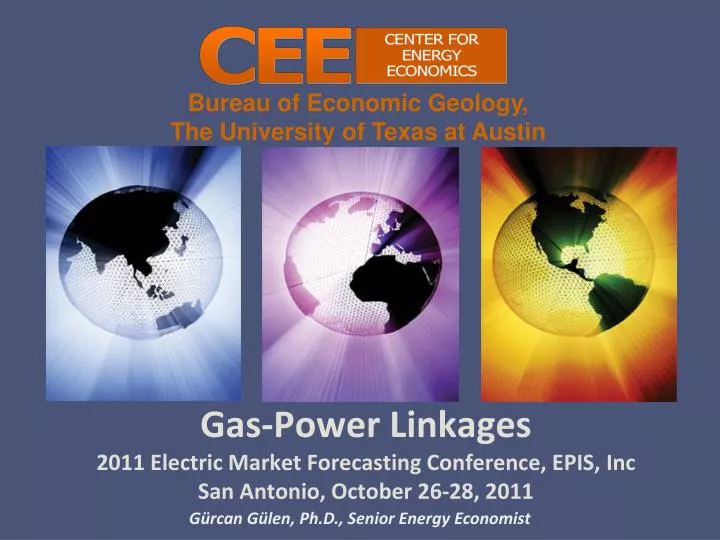
Gas-Power Linkages 2011 Electric Market Forecasting Conference, EPIS, Inc San Antonio, October 26-28, 2011. Gürcan Gülen , Ph.D., Senior Energy Economist. The Boom-Bust Cycle for NG. 35 years ago, we were running out of gas 25-30 years ago, we were in a “bubble”

E N D
Gas-Power Linkages2011 Electric Market Forecasting Conference, EPIS, IncSan Antonio, October 26-28, 2011 GürcanGülen, Ph.D., Senior Energy Economist
The Boom-Bust Cycle for NG • 35 years ago, we were running out of gas • 25-30 years ago, we were in a “bubble” • Ten years ago, we thought we needed LNG • Today, we are “drowning in natural gas” and some wants to export LNG • Shale is the “game changer” but still lots to learn • Even without GHG policy, move to gas seems inevitable (we consumed >24 TCF in 2010 – first time in history) • Drilling is essential but challenged (cost, environmental regulations, tax policies)
Natural Gas Resource Assessments Technically recoverable assessments of the U.S. natural gas endowment 1970 to 2009 increased four to six times: 2,084 Tcf in 2009 Source: Modified from Bill Fisher et. al., BEG-UT; GTI
Shale Gas is a Hedge for Offshore 651 TCF Source: NPC 2007
Production Can Be Expensive Compiled by CEE based on company financial reports
Oil Price Helps if Liquids Rich Discount to Oil CEE based on CME price data
*Price volatility ($2005) * Std dev of change in price CEE analysis
Changing Demand Structure (TCF) Compiled by CEE based on EIA data
Impact of wind – high wind ‘13 Source: ERCOT
CEE Model (cents/kWh) NOTE: Excludes grid costs Capital and O&M costs are based on U.S. EIA’s Nov 2010 report: http://www.eia.gov/oiaf/beck_plantcosts/index.html
More Risk for Coal • Pending EPA regulations on CO2, SO2/NOX, mercury, ash • 6 GW to 65 GW of coal capacity may retire 2011-15* 39 GW *World Resources Institute, review of various studies. Compiled by CEE based on EIA data
EPA Regulations Coal Retirement Source: World Resources Institute
Assessment of probabilities and time frames for each factor Evaluation of second or higher order drivers (environmental regulations – air, water; renewables – mandates, tax credits, feed-in-tariffs; coal mining costs & exports; nuclear policies and finance; smart grid & consumer behavior; macroeconomics & demographics)