Download

1 / 43
430 likes | 559 Vues
Truckee River Water Quality Standards Review. Focus Group Meeting: November 12, 2013. Overview of Topics for Discussion. Welcome and introductions Feedback from previous workshop Technical Updates Updated (DRAFT final ) model simulation results Climate sensitivity runs

E N D
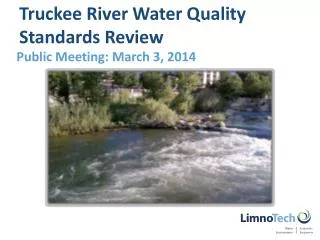
Truckee River Water Quality Standards Review Focus Group Meeting: November 12, 2013
Overview of Topics for Discussion • Welcome and introductions • Feedback from previous workshop • Technical Updates • Updated (DRAFT final) model simulation results • Climate sensitivity runs • Mapping of restoration sites in context of model domain • Next steps • Technical report development and review • NDEP timeline • Focus Group involvement in 2014
Summary of Final Adjustments • Final Model Adjustments – wrapping up loose ends • Minor low flow year adjustments -- closer to 10th percentile targets • Resolved DO concentration initial condition issue • Extended simulations across full range of WQ concentrations • Shifted curves to actual instream (not target) nutrient concentrations • Results: • No major surprises
Representative Flow Conditions • Derived “target flows” based on TROM Future No Action output • Two representative flow regimes • Low Flow (10th percentile) • Average Flow (50th percentile)
Low Flow Regime:TROM1977 FNA, 10th percentile targets, TRHSPF • Adjusted at WARMF-TRHSPF interface • July, August decreased flow • September increased flow • Adjusted summer period for lower river Adjusted at Sparks Jul - Sep Adjusted at TCID
Average Flow Regime:TROM1985 FNA, 10th percentile targets, TRHSPF • No additional adjustment
Options for Calculating Percent Violation of DO WQS % of Hours: attainment is aggregation of all hours that have violated WQS X hours violated 8760 hours/yr % of Days: if 1+ hours violate WQS on a given day, that day is not in attainment X days violated 365 days/yr Reviewing attainment as“% of days” is more conservative approach
Normalized Nutrient Concentrations in DO Compliance Curves • Target concentrations set at upper model boundaries • Adjusted loads at major sources of load input (Steamboat Cr., N. Truckee Drain, lower river agricultural input) • Slight variation in concentrations longitudinally • Plotted “actual” instead of “target” concentration on x-axis • For TN plots, also shifted Y-axis for Ortho-P curve
Example of Curve Normalization Vertical Shift of OP line for TN evaluation (Reach 4 only) Horizontal Shift for OP evaluation
DRAFT Final Results Total P10th Percentile Flow: Reach Averaged % of Days % of Hours TN = 0.75 TN = 0.75
DRAFT Final Results Ortho-P10th Percentile Flow: Reach Averaged % of Days % of Hours TN = 0.75 TN = 0.75
DRAFT Final Results Total Nitrogen10th Percentile Flow: Reach Averaged % of Days % of Hours
Longitudinal Plot: Low Flow Year(DRAFT Final) TN = 0.75 mg/LOP = 0.05 mg/L TN = 0.75 mg/LTP = 0.05 mg/L
DRAFT Final Results Total P50th Percentile Flow: Reach Averaged % of Days % of Hours TN = 0.75 TN = 0.75
DRAFT Final Results Ortho P50th Percentile Flow: Reach Averaged % of Days % of Hours TN = 0.75 TN = 0.75
DRAFT Final Results Total N50th Percentile Flow: Reach Averaged % of Days % of Hours
Longitudinal Plot: Average Flow Year(DRAFT Final) TN = 0.75 mg/LOP = 0.05 mg/L TN = 0.75 mg/LTP = 0.05 mg/L
Summary of DO Compliance (DRAFT Final)Crosshairs run: TN 0.75 / TP 0.05 and TN 0.75 / OP 0.05
Summary of DO Compliance (DRAFT Final)Crosshairs run: TN 0.75 / TP 0.05 and TN 0.75 / OP 0.05 Shading denotes existing phosphorus WQS
Observations • Reaches 1, 2, 3 show low level of DO violation • Reach 4 is most critical at 10th percentile flow • Sensitive to the phosphorus concentration • Not sensitive to the TN concentration • No violations for 50th percentile flows • DO violations in Reach 4 sensitive to other factors beyond P concentration • Flow condition • Channel geometry
Integration of Results Over Full Flow Regime • Results to date have focused on low and average flow conditions • Also evaluated integrated DO violations (DOv) across all flow regimes: DOvall= 0.2*DOvlow + 0.6* DOvave + 0.2*DOvhigh • Spreadsheet calculation • 90th percentile year not simulated • Conservative assumption: DOvhigh=DOvave
Integrated Flow: Reached Averaged TP Ortho-P • % violations in Reach 4 (PLPT) much lower when integrating over all flows than for only the low flow year
Interpretation of WQS Modeling Results • LimnoTech will summarize technical results in a report • NDEP/EPA will determine recommendations for any potential change from existing WQS
General Approach for Climate Sensitivity Runs • Simulated “cross hairs” run for each flow regime • TN 0.75 mg/L, Ortho-P 0.05 mg/L • TN 0.75 mg/L, TP 0.05 mg/L • Adjusted TRHSPF temperature inputs: air water exchange • Applied a 1° C air temperature increase across entire year • First iteration run to estimate maximum water temperature increase (near Marble Bluff Dam) • Applied ΔT ° C water temperature increase at WARMF / TRHSPF interface (McCarran, North Truckee Drain, Steamboat Creek)
Climate Sensitivity Simulation:10th Percentile Flow % of Days % of Hours Modest increase in percent DO violations with increased air and water temperature
Climate Sensitivity Simulation:50th Percentile Flow % of Days % of Hours Modest increase in percent DO violations with increased air and water temperature
River Geomorphology and Restoration • Model is a conservative representation of actual river • TRHSPF parameterized for pre-restoration geometry condition • Mapped completed, ongoing and planned restoration activity • Supplementary information to include in technical report
Marble Bluff Dam (343) Vista (304) Below Derby Dam (320) Tracy (315)
LimnoTech Technical Report • Introduction • Watershed, justification for effort , WQS review process, stakeholder outreach • Summary of models (development, calibration) • Overview of WQS model application approach • Development of representative flow condition • Simulation of DO response to nutrient concentrations • Low Flow Condition • Average Flow Condition • Integration Over full Flow Regime • Discussion of results • Additional considerations • River geometry properties • River restoration • Climate change sensitivity • Observations and conclusions for revision of WQS • Appendices: • Focus Group outreach, comments • Detailed technical information
NDEP Timeline • 12/1/2013: Preliminary Draft LimnoTech report on modeling • 1/1/2014: Review completed by Working Group • 1/15/2014: Draft LimnoTech report on modeling results • Mid Jan: NDEP Public workshop • 2/15/2014: Review completed by Focus Group • 3/1/2014: Final LimnoTech report on modeling results • 4/1/2014: Draft NDEP Rationale/Petition for proposed standards changes • 5/1/2014: NDEP Workshops – Focus Group, general public • 6/30/2014: Final NDEP Rationale/Petition to LCB
Focus Group Involvement 2014 • Focus Group Meeting: Jan 15, 2014 • Overview of Technical Report document • Review of Technical Report • Comments due 2/15/2014 • Additional Stakeholder / Focus Group meetings TBD in 2014
River Geomorphology and Restoration • Supplementary information to include with analysis • Potential relationship between channel geometry and most critical segments • Developed and mapped “indicator” of potentially vulnerable regions • Based on depth, velocity, slope • Mapped restoration activity • Model is a conservative representation of actual river • TRHSPF parameterized for pre-restoration geometry condition
Reach Geometry Index Marble Bluff Dam (343) Tracy (315) Vista (304) Below Derby Dam (320)