Download
1 / 49
520 likes | 732 Vues
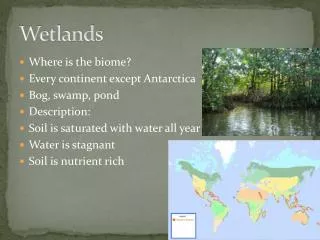
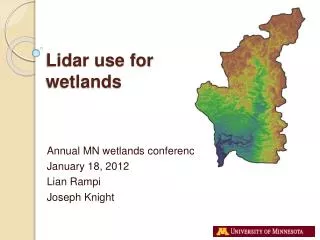
Lidar use for wetlands. Annual MN wetlands conference January 18, 2012 Lian Rampi Joseph Knight. Agenda. What is Lidar? Wetland mapping methods Conclusions. Lidar 101. What is Lidar?

E N D
Lidar use for wetlands Annual MN wetlands conference January 18, 2012 Lian Rampi Joseph Knight
Agenda • What is Lidar? • Wetland mapping methods • Conclusions
Lidar 101 What is Lidar? • Light Detection and Ranging is an active remote sensing technology that uses laser light (laser beams up to 150,000 pulses per second) • Measures properties of scattered light to find range and other information of a distant target • One of the most accurate, suitable and cost-effective ways to capture wide-area elevation information (vs. ground survey)
Lidar 101 What is Lidar? • Utilize a laser emitter-receiver scanning unit, a GPS, an inertial measurement unit (IMU) attached to the scanner, on board computer and a precise clock • Data is directly processed to produce detailed bare earth DEMs at vertical accuracies of 0.15 meters to 1 meter • Lidar cannot penetrate fully closed canopies, water, rain, snow and clouds
All available data is currently accessible via anonymous ftp at: • http://www.mngeo.state.mn.us/chouse/elevation/lidar.html • lidar.dnr.state.mn.us
Wetland mapping methods • Elevation data only • DEM resolution for a Compound Topographic Index (CTI) • Data fusion • 2) Combination of CTI, NDVI and soils data • Random Forest (RF) Classifier • Object based classification
Wetland mapping methods • Elevation data only • DEM resolution for a Compound Topographic Index (CTI)
Wetland mapping methods • Elevation data only • DEM resolution for a CTI • What is the CTI: • Indicator of potential saturated and unsaturated areas within a catchment area (e.g. a watershed) • Function of the Natural log (ln) of the Specific Catchment Area (As) in m² and the Tangent (tan) of the slope (β) in radians • CTI = ln [(As)/ (Tan (β)]
Wetland mapping methods • Elevation data only • DEM resolution for a CTI • Study area
Wetland mapping methods • Elevation data only • DEM resolution for a CTI • Goal: assess the CTI to examine how sensitive this index is to the spatial resolution of several DEMs while predicting wetlands • 3 m Lidar • 9 m Lidar • 10m * • 12m Lidar • 24 m Lidar • 30m * • 33 m Lidar • *DEMs from the 10 m National Elevation Data and 30 m from USGS
Wetland mapping methods • Elevation data only • DEM resolution for a CTI • Results
Wetland mapping methods • Elevation data only • DEM resolution source • Accuracy assessment results Accuracy Assessment using a local reference data (wetland size: from 0.1 acres to 788 acres)
Wetland mapping methods • Elevation data only • DEM resolution for a CTI • Accuracy assessment results Omission Error Commission Error
Wetland mapping methods • Data fusion • Combination of CTI, Normalized Difference Vegetation Index (NDVI) and soils data
Wetland mapping methods • Data fusion • Combination of CTI, NDVI and soils data • Boolean and arithmetic steps using Spatial Analyst tool from ArcGIS software • Goal: Investigate the effectiveness of combining CTI, NDVI, and hydric soils for mapping wetland boundaries • Data sets used: • 24m CTI (Lidar) • Hydric Soils • NDVI = (NIR band – RED band ) / (NIR band + RED band)* • * NDVI calculated from the NAIP imagery, 2008
Wetland mapping methods • Data fusion • Combination of CTI, NDVI and soils data • Assumption behind NDVI
Wetland mapping methods • Data fusion • Combination of CTI, NDVI and soils data • Accuracy assessment results
Wetland mapping methods • Data fusion • Combination of CTI, NDVI and soils data • Results
Wetland mapping methods • Data fusion • 3) Random Forest (RF) Classifier
Wetland mapping methods • Data fusion • 3) Random Forest (RF) Classifier • Goal: investigate the use of the RF classifier for mapping wetlands using different data types • Study area: a small area of the Big Stone lake park sub-watershed in Big Stone County, MN
Wetland mapping methods • Data fusion • 3) Random Forest (RF) Classifier: Study area
Wetland mapping methods • Data fusion • 3) Random Forest (RF) Classifier • Data sets used: • Lidar DEM, Lidar intensity, Spring 2010(leaf off conditions) • CTI derived from the 3m lidar DEM • NAIP imagery 2008, Leaf On aerial imagery • Hydric Soils * • Organic Matter * • Slope • *NRCS SSURGO database
Wetland mapping methods • Data fusion • 3) Random Forest (RF) Classifier • Data Used – Lidar intensity
Wetland mapping methods • Data fusion • 3) Random Forest (RF) Classifier • Data Used – DEM and Slope (Lidar)
Wetland mapping methods • Data fusion • 3) Random Forest (RF) Classifier • Data used – CTI (Lidar)
Wetland mapping methods • Data fusion • 3) Random Forest (RF) Classifier • Results Random Forest results: Top 10 important variables CTI Intensity Green band IR band DEM Red band Slope Blue band Hydric Soils OM Mean Decrease Gini
Wetland mapping methods • Data fusion • 3) Random Forest (RF) Classifier - Results Partial dependence on Intensity Partial dependence on Green band Partial dependence on CTI Intensity Green band CTI Partial dependence on IR band Partial dependence on DEM IR band DEM
Wetland mapping methods • Data fusion • 3) Random Forest (RF) Classifier • Results UB (Unconsolidated bottom) CW (Cultivated wetland) EM (Emergent wetland)
Wetland mapping methods • Data fusion • 3) Random Forest (RF) Classifier • Accuracy assessment results
Wetland mapping methods • Data fusion • 4) Object based classification
Wetland mapping methods • Data fusion • 4) Object based classification • Goal: Evaluate the performance of an object based classification for identifying wetlands • Data sets used • 2003, 2008 NAIP leaf on imagery • 2005 NAIP leaf off imagery • NDVI leaf off 2005 and leaf on 2008 • 3 m DEM • Slope • CTI 3m • Thematic lake layer
Wetland mapping methods • Data fusion • 4) Object based classification • Pilot study area • The Northeast and Central East area of the city of Chanhassen • Good representation of the variety of wetland types in the entire city
Wetland mapping methods • Data fusion • 4) Object based classification • Methodology • Image segmentation • Hierarchical object-based classification • These objects were classified either as wetlands or • uplands/others : • Urban areas: residential areas, buildings and roads • Lakes • Tree canopy • Agricultural fields • Grasses and bare soils
Wetland mapping methods • Data fusion • 4) Object based classification • Methodology • 2) Hierarchical object-based classification based on the following attributes: • Shape • Color • Texture • Object features : • NDVI values • Imagery brightness values • Infrared band & red band mean values reflectance from optical imagery
Wetland mapping methods • Data fusion • 4) Object based classification • Methodology • Main algorithms used: • Image classification • Image object fusion • Morphology operations • Geographic Information System (GIS)-post processing to generalize objects
Wetland mapping methods • Data fusion • 4)Object based classification • Results OBIA wetland polygons
Wetland mapping methods • Data fusion • 4) Object based classification - Results North East area, Chanhassen City Central East area, Chanhassen City OBIA wetland polygons
Wetland mapping methods • Data fusion • 4) Object based classification - Results North East area, Chanhassen City Central East area, Chanhassen City OBIA wetland polygons Reference data wetlands polygons
Wetland mapping methods • Data fusion • 4) Object based classification • Accuracy assessment results
Conclusion • DEM quality is important for the development of terrain indices used for mapping wetlands. • LIDAR DEM outperforms 10 m NED & 30 m USGS in accuracy assessment. • Random forest helped to determine key input variables for wetland mapping classification and resulted in higher accuracy for wetland mapping.
Conclusion • Combination of lidar DEM, CTI, aerial imagery and NDVI for an object based classification performs better with higher overall accuracy compared to the CTI method. • 5) Several factors to keep in mind to decide which method is the best for wetland mapping.
Acknowledgments • David Mulla and his research group (UMN) • Paul Bolstad (UMN) • Remote Sensing and Geospatial Analysis Laboratory (UMN): • Jennifer Corcoran • Bryan Tolcser • Steve Kloiber (MN, DNR) • Tim Loesch (MN, DNR) • Carver County
Acknowledgments • Funding for this project was provided by the Minnesota the Environment and Natural Resources Trust Fund through the Department of Natural Resources (MN DNR)
Thank you for your attention!