Download
1 / 58
580 likes | 584 Vues
Explore the forces that shape political attitudes, analyze different ideologies, examine forms of political participation, and understand why people vote the way they do.

E N D
7 Public Opinion, Ideology, Participation, and Voting
7 Learning Objectives Identify the forces that create and shape individuals’ political attitudes 7.1 Describe the key dimensions of public opinion, how public opinion is measured, and the relationship between public opinion and public policy 7.2
7 Learning Objectives Compare and contrast political ideologies and evaluate the critiques of each ideology 7.3 Identify forms of political participation, and assess the effect on voter turnout of demographic, legal, and electioneering factors 7.4
7 Learning Objectives Analyze why people vote the way they do in elections 7.5 2.2
Forming Political Opinions and Values 7.1 • Political Socialization • Stability and Change • Awareness and Interest
Political Socialization Family influences political partisanship Schools Pledge of Allegiance introduces respect for country Peers and social media Mass media Selective exposure Other influences Religious, ethnic, racial backgrounds Not all conform to stereotypes 7.1
7.1 Facebook
Stability and Change Core values remain stable over time Extra ordinary events can be catalysts for change Deliberation and social capital 7.1
7.1 FIGURE 7.1: Comparison of opinion of President George W. Bush and Barack Obama with attitude on abortion over time
Awareness and Interest Poor public knowledge of candidates and issues Attentive public is approximately 25% of total adult population Participants have more influence than nonparticipants 7.1
7.1 7.1Which of the following is the most powerful agent of socialization? • Schools • The mass media • Peer groups • Family
7.1 7.1Which of the following is the most powerful agent of socialization? • Schools • The mass media • Peer groups • Family
Public Opinion: Taking thePulse of the People 7.2 • What Is Public Opinion? • Public Opinion and Public Policy • Measuring Public Opinion
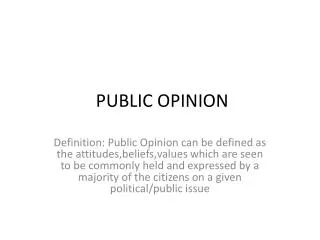
What Is Public Opinion? Distribution of individual preferences within a specific population Proportion of people with an opinion vs. those opposing or without Most accurately measured through polling 7.2
Measuring Public Opinion Random sampling and margin of error Intensity Measures how strongly an individual holds a particular opinion Latency Political opinions that are held but not yet expressed Salience An individual’s belief that an issue is important or relevant to him or her 7.2
7.2 Polls
7.2 TABLE 7.1 The way you ask the question matters
7.3 TABLE 7.2: Differing opinions on gay marriage
Public Opinion and Public Policy Polling How politicians are informed of public opinion Polls are paid by politicians, public, or the media Cyclical relationship Opinion shapes policy, which shapes opinion 7.2
7.2 7.2Which of the following refers to the proportion of the population that holds a particular opinion? • Salience • Margin of error • Latency • Distribution
7.2 7.2Which of the following refers to the proportion of the population that holds a particular opinion? • Salience • Margin of error • Latency • Distribution
Political Ideology and Attitudes Toward Government 7.3 • Liberalism • Conservatism • Socialism and Communism • Libertarianism
Liberalism Contemporary liberals Believe that government can bring about justice and equality of opportunity Criticisms of liberalism Over-reliance on government, taxes, and bureaucracy 7.3
7.3 Pro-abortion protest
Conservatism Traditional conservatives Believe in private property rights and free enterprise Social conservatives Focus less on economics and more on morality and lifestyle Criticisms of conservatism Urge more government when it serves their own purposes 7.3
7.3 No Child Left Behind
7.2 TABLE 7.3: Differences in political ideology
7.3 Senator Jim DeMint
7.3 Senator Richard Durbin
Socialism and Communism Socialism — public ownership of the means of production Wide role for government-provided social programs Communism – state-owned property and a single political party 7.3
Libertarianism Stress individual liberties and sharply limited government Support withdrawal from United Nations Would repeal laws that regulate personal morality Ron Paul 7.3
7.3 FIGURE 7.2: Ideology over time
7.3 7.3Which ideology is emphatically pro-business? • Socialism • Communism • Liberalism • Conservatism
7.3 7.3Which ideology is emphatically pro-business? • Socialism • Communism • Liberalism • Conservatism
Participation: TranslatingOpinions into Action 7.4 • Voting • Turnout • Who Votes? • Mobilization • How Serious Is Nonvoting?
7.4 FIGURE 7.3: Political participation and awareness in the United States
Voting Registration Has discouraged voting due to extra step Motor Voter bill Eases registration burdens Absentee and Early Voting 2008 marked a historical high for absentee voters 7.4
7.4 TABLE 7.4: Women’s suffrage timeline
7.4 TABLE 7.5: Changes in voting eligibility standards since 1870
Turnout United States holds more elections than any other democracy General Primary Special Turnout is highest in presidential general elections; lowest in local elections 7.4
7.4 FIGURE 7.4: Voter turnout in presidential elections, 1789–2008
7.4 FIGURE 7.5: Voter turnout in presidential and midterm elections, 1992–2010
Who Votes? Education is the most important predictor in whether people will vote Race Ethnic background Women have voted in greater numbers than men since 1984 Due to increasing levels of education and employment 7.4
Mobilization “Banking” the vote Mailings and phone calls Early voting Canvassing potential voters Undecided “swing” voters Focus of major mobilization efforts 7.4
How Serious Is Nonvoting? 40% of eligible citizens fail to vote Approximately 80 million people Some argue nonvoting does not change outcomes Low voter turnout may indicate approval of the status quo High voter turnout may signal desire for change 7.4
7.4 TABLE 7.6: Why people do not vote
7.4 7.4Which of the following is likely to draw the highest turnout? • Congressional special election • Gubernatorial primary election • Municipal mayoral election • Presidential general election
7.4 7.4Which of the following is likely to draw the highest turnout? • Congressional special election • Gubernatorial primary election • Municipal mayoral election • Presidential general election