Download
1 / 25
250 likes | 365 Vues
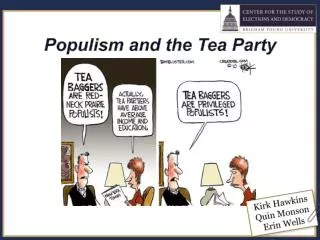
Party and the Tea Party Among Aiken County Voters. Bob Botsch Political Science USC Aiken. USC Aiken Surveys. Began in early 1980s – Research M ethods classes Formed Organization for Public Service and contractual work: SSBRL—Social Science and Business Research Lab

E N D
Party and the Tea Party Among Aiken County Voters Bob Botsch Political Science USC Aiken
USC Aiken Surveys • Began in early 1980s – Research Methods classes • Formed Organization for Public Service and contractual work: SSBRL—Social Science and Business Research Lab • Reports on line at: http://www.usca.edu/polisci/SSBRLab/ • Perform wide variety of research/surveys
Gender Gap (2010 Exit Poll) • Males: 22% Dem – 57% Rep • Females: 35% Dem – 52% Rep
Ethnicity • Whites: 13% Dem – 67% Rep • Blacks: 92% Dem – 3% Rep • Turnout: Blacks comprise 25% of the population but only 20% of voters • If Dem won ALL black votes, still need 30 of the remaining 80 percentage points of the white vote, or 38% of the total white vote
Age: averages • Democrats average age: 51 • Republicans average age: 56
Regional Identification • Native Southerners: 28% Dem – 57% Rep • Converted Southrn: 21% Dem – 59% Rep • Non-Southerners: 39% Dem – 39% Rep • Non-Southerners comprise about 12% of all voters; Native Southerners about 68%
Religious Fundamentalism • Fundamentalists: 25% Dem – 64% Rep • Non-Fundamentalists: 30% Dem – 49% Rep
Ideology of all Voters • Hard for non-conservatives to win in Aiken County • Liberals comprised 15% of all voters • Mid Road/Not Sure’s: 27% of all voters • Conservatives: 58% of all voters
Issue: Irritated when hear people speaking Spanish in public? • Democrats: 36% Irritated – 65% Not • Independents: 47% Irritated – 54% Not • Republicans: 54% Irritated – 46% Not • Overall: 47% Irritated – 53% Not
Issue: Social Security—keep or phase out w/ voluntary savings • Democrats: 97% Keep – 3% Phase Out • Independents: 85% Keep – 15% Phase Out • Republicans: 84% Keep – 16% Phase Out
Issue: Health Care—cover all; only old, poor child, disabled; or free market • Democrats: 94% all; 4% o/pc/d; 2% fm • Independents: 43% all; 21% o/pc/d; 37% fm • Republicans: 17% all; 29% o/pc/d; 55% fm • All voters: 43% all; 20% o/pc/d; 37% fm
Issue: School Vouchers— oppose b/c take $ from public schools; support b/c would increase competition • Democrats: 70% oppose – 30% support • Independents: 56% oppose – 44% support • Republicans: 37% oppose – 64% support • All voters: 50% oppose – 50% support
Issue: Abortion—pro life; mid ground; or pro choice • Democrats: 14% p/l; 26% mid; 61% p/c • Independents: 14% p/l; 35% mid; 51% p/c • Republicans: 26% p/l; 46% mid; 28% p/c • All voters: 20% p/l; 39% mid; 41% p/c
Issue: Obama is really a Muslim?no – yes – not sure • Democrats: 93% no – 2% yes – 6% n/s • Independents: 52% no – 27% yes – 21% n/s • Republicans: 30% no – 42% yes – 28% n/s • All voters: 52% no – 28% yes – 20% n/s
Tea Party Supporters • Supporters: 1% Dem – 82% Rep • Non-supporters: 57% Dem – 25% Rep • Tea party Supporters comprised 43% of all voters • And 65% of all Republican voters • Non-Tea Party Republicans are quite different than Tea Party Supporters—as we shall see!
How Tea Party Supporters Differ • Should politicians compromise? • Dem: 90% Ind: 96% Rep: 82% TP: 64% • Support school vouchers? • Dem: 25% Ind: 22% Rep: 38% TP: 60% • Health care run totally by free market? • Dem: 2% Ind: 15% Rep: 47% TP: 61% • Religion very important in vote choice? • Dem: 24% Ind: 9% Rep: 25% TP: 34%
Continued • Never bothered by Spanish in public? • Dem: 64% Ind: 60% Rep: 55% TP: 42% • Phase out Social Security? • Dem: 2% Ind: 6% Rep: 9% TP: 21% • Prefer helpful leaders over strong leaders? • Dem: 88% Ind: 72% Rep: 58% TP: 49% • Cut spending over stim econ & save programs? • Dem: 9% Ind: 41% Rep: 61% TP: 86%
continued • Pro choice on abortion? • Dem: 56% Ind: 63% Rep: 41% TP: 22% • Self-identify as Religious Fundamentalists? • Dem: 27% Ind: 11% Rep: 28% TP: 38% • Family income > $50k last year? • Dem: 44% Ind: 65% Rep: 59% TP: 68% • Political Ideology: Moderates? • Dem: 50% Ind: 53% Rep: 22% TP: 9%
Conclusions • Current huge advantage for GOP and conservatives • unless more moderate Republicans become alienated by Tea Party extremism • Note: county less conservative on issues than in labels • Long term demographics favor more competitive elections • Because of age and non-southerners