Download
1 / 27
270 likes | 273 Vues
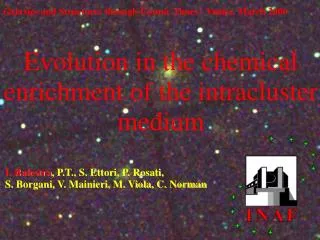
Galaxies and Structures through Cosmic Times - Venice, March 2006. Evolution in the chemical enrichment of the intracluster medium. I. Balestra , P.T., S. Ettori, P. Rosati, S. Borgani, V. Mainieri, M. Viola, C. Norman. High redshift (z>0.3) clusters in medium- deep Chandra exposures

E N D
Galaxies and Structures through Cosmic Times - Venice, March 2006 Evolution in the chemical enrichment of the intracluster medium I. Balestra, P.T., S. Ettori, P. Rosati, S. Borgani, V. Mainieri, M. Viola, C. Norman
High redshift (z>0.3) clusters in medium- deep Chandra exposures (ACIS-I and ACIS-S) Science: Scaling relations (temperature, luminosity, mass entropy) Chemical enrichment AGN around clusters Baryon fraction and cosmological test
RXJ1252: detection of the Fe line at z=1.23 Rosati et al. 2004
Fe Ions concentration as a function of the ICM temperature 5 -10 keV Fe XXV Fe XXVI Collisionally dominated optically thin coronal plasma as a function of electron temperature (Mewe 1991) The Iron abundance is determined almost uniquely by the K-shell complex at 6.7-6.9 keV rest-frame
Distribution with temperature and redshift of the sample We select from the Chandra archive 56 clusters at z>0.3 (among them 7 clusters at z>1)
We sample central regions between 0.15 and 0.3 Rvir depending on the redshift of the cluster
Temperature vs redshift (56 clusters @ z> 0.3) 3 times more objects than in Tozzi et al. 2003 Caveat: two different values of solar Fe abund in the literature: Anders & Grevesse 1989 Fe/H = 4.68 × 10⁻⁵ Grevesse & Sauval 1998 Fe/H = 3.16 × 10⁻⁵ ZFeGS = 1.48 ZFeAG Balestra et al. 2006
Fe abundance-Temperature in different redshift bins Scatter comparable with statistical errors hint of higher Fe abundance at low kT<5 keV
Iron abundance -Temperature Weighted average Anders & Grevesse 1989 Balestra et al. 2006
18 local clusters observed with ASCA Finoguenov, Arnaud & David 2001 Local sample 273 clusters observed with ASCA Horner 2001 PhD Baumgartner et al. 2005 Grevesse & Sauval 1998 Anders & Grevesse 1989 XMM-Grating data from cool core cluster Peterson et al. 2003
Iron abundance versus redshift Balestra et al. 2006
Average Iron abundance versus redshift This larger sample shows higher ZFe at z<0.5, implying significant evolution (Tozzi et al. 2003 was still consistent with no evolution, with weak hints of decrease at less than 2 σ c.l.) We find an increase of a factor about 2 in ZFe from z=1.2 to z=0.4 in the central 0.2 Rvir of hot clusters consistent with ZFe = 0.55 (1+z)-1.3 Balestra et al. 2006
It is known that locally ZFe = 0.6 in cold-core clusters and Zfe = 0.2/0.3 in non cold-core clusters (see De Grandi et al. 2001; 2004). Is this evolution associated to the evolution of the cold-cores with Iron peak within the central 0.1 Rvir? First check: Iron abundances are not affected by removal of the low energy part of the spectrum, nor by masking of the central 0.1 Rvir (when possible) More directly, there is no correlation with the central surface brightness (cooling time)
Is the Iron abundance evolution expected? Fe abundance in the ICM from the observed cosmic Star Formation Rate with different delay times for TyIa Sne Ettori 2005
CONCLUSIONS A sample of ~56 clusters @ z>0.3 observed with Chandra Clear detection of the Iron line in the large majority of high-z clusters, up to z~1.3 Correlation in the Iron abundance – Temperature relation at high-z: Iron abundance starts to increase below 5 keV Fe abundance ~ 0.25 Z⊙ constant for z>0.6 Higher average Fe abundance in the z~0.4-0.6 redshift range The decrease of the average Iron abundance from ZFe=0.4 Z⊙(@ z~0.3) to ZFe=0.2 Z⊙ (z~1.3), consistent with cosmic star formation rate only for large TyIa delay times. Open question: production of diffusion of Fe enriched gas between z=1.2 and z=0.4?
Temperature and Fe abundance from Chandra+XMM (MOS) combined fit Rosati et al. 2004
Redshift measure from Chandra+XMM (MOS) combined fit Rosati et al. 2004
Detection of the Fe line of the most distant X-ray clusters RXJ1252 ~1000 net counts 180 ks with ACIS-I Rosati et al. 2004 Chandra+XMM observation of RXJ1252 Rosati et al. 2003
Is it due to cool core with Iron excess? Simplistic spatial spectroscopy (first 2 rings with reasonable S/N) kT < 5 keV Iron-rich clusters do not necessarily show Iron-rich cores
What is the nature of low temperature, Iron rich clusters? A typical example: V14156, z=0.4
Investigating the nature of Fe-rich clusters: Simulated XMM spectrum of V1416 - 50 ksec XMM proposal: Why low-temperature clusters have high Iron abundance? The case at 0.2 < z < 0.5
Can we measure the elements at high redshifts through the stacking technique? Residual of the spectra with respect to the bremmstrahlung only model Ettori et al in progress
The residuals match with expected lines from Si, Ca, and S! Ettori et al in progress
Abundance ratios at z~1 as diagnostic tool Ettori et al. 2005