Download
1 / 44
440 likes | 445 Vues
HIV Infection in Michigan January 1, 2012. Michigan Department of Community Health HIV/STD/VH/TB Epidemiology Section Division of Communicable Diseases Bureau of Disease Control, Prevention and Epidemiology. Quarterly HIV Surveillance Report, Michigan January 2012.

E N D
HIV Infection in MichiganJanuary 1, 2012 Michigan Department of Community Health HIV/STD/VH/TB Epidemiology Section Division of Communicable Diseases Bureau of Disease Control, Prevention and Epidemiology
Quarterly HIV Surveillance Report, MichiganJanuary 2012 • This presentation was created as a companion to the Quarterly HIV Surveillance Report, data as of January 1, 2012. • Please refer to the quarterly report for further details, definitions and technical notes: http://www.michigan.gov/documents/mdch/Jan_2012_374579_7.pdf
Section 1 Data on Prevalent Cases
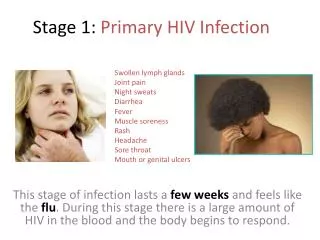
HIV Prevalence Estimate The prevalence estimate is updated each January and calculated by adding the following: • Number of reported cases living with HIV infection diagnosed in Michigan • Estimated number of diagnoses HIV infected cases not yet reported • Estimated number of HIV infected cases not yet tested
Persons Living in Michigan with HIV Infection by Age at Diagnosis January 1, 2012
Risk Transmission Categories • Risk transmission categories are the hierarchical risk categories that have been used for displaying HIV transmission risk in Michigan and national HIV/AIDS statistics since the 1980’s. • The order from top to bottom is meant to represent that most likely route through which HIV is transmitted, and thus implies that some modes of transmission are more efficient than others.
Risk Transmission Categories • Risk categories were redefined for this quarter (as of January 2012). The heterosexual contact (HC) category is now defined as follows: • Heterosexual contact w/female risk (HCFR): males whose female sexual partners are known to be HIV-infected or at high risk for HIV. These partners meet one of the following criteria: IDU, hemophiliac, HIV infected transfusion recipient, or other HIV infected person of unknown risk • Heterosexual contact w/male (HCM): females who have had sex with a male regardless of what is known about the male’s HIV status or exposure
Exposure Categories • Exposure categories convey all behaviors that a person is documented to have engaged in that could have exposed him or her to HIV. • Like the traditional risk hierarchy categories, the exposure categories are mutually exclusive, meaning that each person is only included in one category. • Michigan is the first state to display mode of transmission using exposure categories. The plan is to convert to these categories nationally as well.
Exposure Categories • Exposure categories were redefined for this quarter (January 2012). The heterosexual contact (HC) category is now defined as follows: • Heterosexual contact w/female (HCF): males who have had sex with a female regardless of what is known about the female’s HIV status or behaviors • Previously only included males with partner(s) with known risk (HCFR) • Heterosexual contact w/male (HCM): females who have had sex with a male regardless of what is known about the male’s HIV status or exposure
Any IDU 14% Any MSM 53% Any heterosexual 57% Behaviorally bisexual men 20% *All categories are mutually exclusive; categories with <1% of cases were not included in this pie chart. The categories with <1% were MSM & blood products, MSM & HC & blood products, MSM & IDU & blood products, MSM & HC & IDU & blood products, HC & IDU & blood products, IDU & blood products, and exposure to blood products only
Any IDU 13% Any MSM 68% Any heterosexual 48% Behaviorally bisexual men 25% *All categories are mutually exclusive; categories with <1% of cases were not included in this pie chart. The categories with <1% were MSM & blood products, MSM & HC & blood products, MSM & IDU & blood products, MSM & HC & IDU & blood products, HC & blood products, HC & IDU & blood products, IDU & blood products, and exposure to blood products only
Any IDU 17% Any heterosexual 89% *All categories are mutually exclusive; categories with <1% of cases were not included in this pie chart. The categories with <1% were HC & IDU & blood products, IDU & blood products, and exposure to blood products only
Summarized Exposure Categories (NOT mutually exclusive: one case may be represented in multiple categories)
Section 2 New Diagnoses, Deaths, Prevalence
HIV Infection Prevalence New HIV Diagnoses Deaths † Reporting for 2010 is incomplete at this time.
HIV Related Deaths in MI, all ages, by Race and Sex 1987-2009 Number of Deaths Year of Death 2/15/11
Leading Causes of Death Among Black Men in MI Ages 25-44 1990-2009 Number of Deaths Year 2/15/11
Leading Causes of Death Among White Men in MIAges 25-44 1990-2009 Number of Deaths Year 2/15/11
Leading Causes of Death Among Black Women in MIAges 25-44 1990-2009 Number of Deaths Year 2/15/11
Leading Causes of Death Among White Women in MIAges 25-44 1990-2009 Number of Deaths Year 2/15/11
Section 3 Demographic and Risk Information on Persons Newly Diagnosed with HIV
*Data for cases diagnosed in 2011 are incomplete at this time.
*Data for cases diagnosed in 2011 are incomplete at this time.
*Data for cases diagnosed in 2011 are incomplete at this time. There were no cases with infection status: AIDS-long lag.
Section 4 Demographic Information on Persons Ever Diagnosed with HIV
* Includes deceased cases. Data for cases diagnosed in 2011 are incomplete at this time
*Includes deceased cases. Data for cases diagnosed in 2011 are incomplete at this time.
*Includes deceased cases. Data for cases diagnosed in 2011 are incomplete at this time.
Section 5 Geographic Distribution of HIV Infection
Section 6 Information on Perinatally HIV Exposed Infants