Download
1 / 40
410 likes | 419 Vues
Risk Event Modeling. Intaver Institute Inc. 303, 6707, Elbow Drive S.W, Calgary, AB, Canada Tel: +1 (403) 692-2252 Fax: +1 (403) 459-4533 www.intaver.com. 4280 East Tamiami Trail, 302-M, Naples Florida, 34112, USA Tel: +1(510) 984 3527. The Project Management Problem.

E N D
Risk Event Modeling Intaver Institute Inc. 303, 6707, Elbow Drive S.W, Calgary, AB, Canada Tel: +1 (403) 692-2252 Fax: +1 (403) 459-4533 www.intaver.com 4280 East Tamiami Trail, 302-M, Naples Florida, 34112, USA Tel: +1(510) 984 3527
The Project Management Problem Many projects are unsuccessful! 2009 Intaver Institute
The Project Management Problem 2009 Intaver Institute
The Project Management Problem 2009 Intaver Institute
The Project Management Problem 2009 Intaver Institute
The Project Management Problem 2009 Intaver Institute
Benefits 2009 Intaver Institute
Risk Event Modeling Workflow 2009 Intaver Institute
Risk Definition • Risks • Risks are “events” that have a probability of occurring during a project • Risks are identified and assigned to tasks or resources • Define impact of risks by assigning: • Chance of occurrence • Outcome (e.g. delay, increase in cost) • Result (percentage or fixed value of outcome) 2009 Intaver Institute
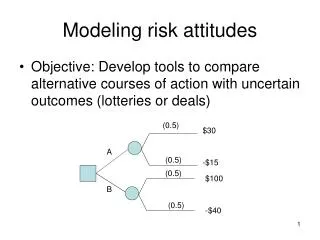
What is Monte Carlo Monte Carlo simulation is a mathematical method used in risk analysis. Monte Carlo simulations are used to approximate the distribution of potential results based on probabilistic inputs.
Two Approaches to Estimating Probabilities • The relative frequency approach, where probability equals the number of occurrences of specific outcome (or event) divided by the total number of possible outcomes. • The subjective approach represents an expert’s degree of belief that a particular outcome will occur.
Two Approaches for Defining Uncertainties • Distribution-based approach • Event-based approach
Which Distribution Should Be Used? Also useful: • Lognornal • Beta
Before Eliciting Judgment You Need to Have: • A clearly defined problem • An identified list of risks, or a risk breakdown structure, for the project • A project schedule • A clearly defined set of questions you will ask experts In addition, your team of experts should be aware of any personal interest that expert may have regarding particular issues. It helps to mitigate motivational biases.
Psychological Factors • Availability heuristic: people judge the probability of the occurrence of events by how easily these events are brought to mind. • Anchoring heuristic:refers to the human tendency to remain close to the initial estimate. • Wishful thinking: when we overestimate the probabilities of opportunities and underestimate the probabilities of risks.
Overestimating the Probability of Compound Events If the probability of a defect in a component is 20% and the device uses three redundant components, the probability of the defective device will be (0.2 * 0.2 * 0.2) = 0.008%. People tend to think this number is much higher.
Ignoring Base-Rate Frequencies • Historically, the probability that a particular component will be defective is 1%. • The component is tested before installation. • The test showed that the component is defective. • The test usually successfully identifies defective components 80% of the time. • What is the probability that a component is defective? The correct answer is close to 4%, however, most people would think that answer is a little bit lower than 80%.
Eliciting Probabilities of Events • Pose a direct question: “What is the probability that the project will be canceled due to budgetary problems?” • Ask the experts two opposing questions: (1) “What is the probability that the project will be canceled?” and (2) “What is the probability the project will be completed?” The sum of these two assessments should be 100%. • Break compound events into simple events and review them separately.
How Many Trials Are Required? Huge number of trials (> 1000) usually does not increase accuracy of analysis • Incorporate rare events • Use convergence monitoring
What Is The Chance That a Project Will Be on Time and Budget?
Analysis of Monte Carlo Results • Sensitivity and Correlations • Critical Indices • Crucial tasks • Critical Risks • Probabilistic Calendars • Deadlines • Conditional Branching • Probabilistic Branching • Chance of Task Existence
Analyze Results 2009 Intaver Institute
Project Gantt When you have project schedule and risk breakdown structure ready click here to perform Monte Carlo simulations 2009 Intaver Institute
Risk Register Pre-mitigation Probability, Impact, And Score 2009 Intaver Institute
Result Gantt Chart White bars represent original project schedule (no risks) Blue bars represent project schedule with risks Because of risks, project duration significantly increased 2009 Intaver Institute
Results of Risk Analysis Project Summary: project duration, cost, and finish time with and without risks Results of analysis for project cost, finish time, and duration Double click on any chart to view detailed information 2009 Intaver Institute
Detailed Results of Analysis Detailed results can be shown for each tasks or whole project for cost, duration, start time, finish time, and income. Move the slider to determine the chance that project will be within budget Get detailed statistical data Data can be exported as an image or text
Sensitivity Critical risks need to be mitigated first Tornado chart shows risks or other parameters that have the most affect on the project schedule
Crucial Tasks Crucial tasks for project cost and duration can be different Crucial tasks have the most affect on the project schedule
Success Rate A task can be canceled if it reaches a task or a project deadline or if it is affected by risk with a “Cancel task” outcome. Success rate is calculated based on number of times the task is not canceled
Risk Chart Risk chart show risks, associated with task versus duration or cost This task has cost and high risk These tasks have balanced risk versus Cost ratio.
Risk Matrix Risk matrix shows probability/impact on 5x5 matrix Double-click on a risk to view risk assignments Risk Probability, Impact and Score for the current schedule
Risk Planning • Modeling risk mitigation efforts • Risk handling strategies • Transfer • Mitigate • Eliminate • Ignore • Risk mitigation efforts represent their own costs etc. which must be accounted for • Create multiple baselines that model pre and post mitigation risk handling efforts • View results of risk handling efforts • Select project alternative based on criteria (cost, duration, start and finish time, success rate)
Additional Resources Project Think: Why Good Managers Make Poor Project Choices Project Decisions: The Art and Science Introduction to Project Risk Management and Decision Analysis Project Risk Analysis Made Ridiculously Simple