Download
1 / 21
210 likes | 319 Vues
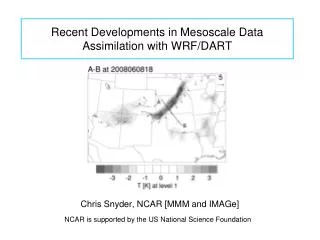
Recent Developments in assimilation of ATOVS at JMA. Kozo Okamoto , Yoshiaki Takeuchi, Yukihiro Kaido, Masahiro Kazumori NWP Division, Forecast Dept, Japan Meteorological Agency. 1.Introduction 2.1DVar preprocessor 3.Simple test for 3DVar radiance assimilation 4.Cycle experiments

E N D
Recent Developments in assimilation of ATOVS at JMA Kozo Okamoto, Yoshiaki Takeuchi, Yukihiro Kaido, Masahiro KazumoriNWP Division, Forecast Dept, Japan Meteorological Agency 1.Introduction 2.1DVar preprocessor 3.Simple test for 3DVar radiance assimilation 4.Cycle experiments 5.Conclusion and plan
Recent Change in the JMA NWP system • Mar. 2001 : Replace the supercomputer (768GFlops, 640GByte, 80node) GSM T213L30 => T213L40 (model top : 10=>0.4 hPa) • Sep. 2001 : Global 3DVar system started in operational data assimilation system • Mar. 2002 : Meso 4DVar system is going to start in operational data assimilation system (H.Res.: 10km, Assimilation window: 3h)
Use of ATOVS in the JMA assimilation system Present Status Retrieval Use PlanTBB Use 1DVar as preprocessor NESDIS/MSCT,Q retrievals NESDIS 120km BUFR TBB ・QC ・Channel Selection・Obs Error Assignment・Bias Correction ・conversion・QC・select region Bias Corrected TBBTskin dZ( -1000hPa) 3DVar 3DVar
ATOVS 1DVar as Pre-processor (1)Quality Control (QC) • Geographical check : reject data over the coast, lake and river .. • Edge scan check: reject data with outer edge swath • Gross check : reject data for TBB >400K or <100K • Rogue check-1: reject data including some channels with |dTBB|>a*Ostd • Minimize check: reject data not converged within 12 iterations • Jend check: reject data with Jend>8*used channel number • Rogue check-2: tighter Rogue check-1
ATOVS 1DVar as Pre-processor (2)Bias Correction • The TBB bias for each channel j can be described by • y: background TBB (TBbg) of AMSU-5,7,10 • TPW: background total column precipitable water • : satellite scan angle, Ts:skin temperature • overbar represents spatial and temporal mean • The regression coefficients ajiare updated every day using previous 2 weeks data and calculated for NH/Trop/SH and each analysis time. • The bias-correction is not applied to HIRS11,12,AMSU13,14 because of large systematic errors in the JMA forecast model
ATOVS 1DVar as Pre-processor (3)Channel Selection and Observation Errors HIRS The channels to be used and observation errors for each observation condition : Clear/Cloudy and Sea/Ice/Land • Clear Sea : HIRS1-8, HIRS10-16, AMSU5-14 • Land : only HIRS1-3 and AMSU 8-14 are used. • Observation errors used in 3DVar are multiplied by 1.5. • At the moment, • Cloud detection is based on NESDIS flag • Ice detection based on SST<1K and the classification is corrected as sea when TBob - TBbg <-50 for AMSU1 AMSU-A
Surface type and TBob-TBbg • Due to mis-classimication of surface type, TBbg is quite different from TBob. • The mis-classification of the coast accounts for 95% of data with TBob-TBbg >50K • The mis-classification of the sea ice accounts for 98% of data with TBob-TBbg <-50K Distribution of data with large TBob-TBbg for AMSU A1 (10 Oct - 11 Nov 2001)
JMA 3DVar • Incremental method • Outer loop : T213L40 • Inner loop : T106L40 • Background error covariance is calculated by using the NMC method • Horizontal homogeneous • Observation operator for radiance data • RTTOV6 ADJ and TL model
Evolution of Cost function J and Gradient of J with iteration Radiance Assimilation Retrievals Assimilation • The minimization is continued for 100 iterations • Case of 12Z on 18th Dec. 2001 All Cost J All Radiance Z Others Others |gradJ|
Cross Section along observation longitude(137E) Analysis Increment for 1ch-1point observation Z[m] T[K] • Only one HIRS4 observation with TBB departure of +10*Observation error STD is assimilated at the point of 35N,137E • Analysis Increments are large in the stratosphere because of the large background error covariance and wide spread RT sensitivity. 0.4 10 100 300 500 700 0.4 10 100 300 500 700 Q[g/kg] U[m/s] 0.4 10 100 300 500 700 0.4 10 100 300 500 700
At the 35th level of JMA eta level (around 10hPa) Analysis Increment for 1ch-1point observation T[K] Z[m] Q[g/kg] U[m/s]
ATOVS Radiance Assimilation Impacts on NWP -Parallel Assimilation Experiments (Jul 2001)- • TEST : 1DVar preprocessor + 3DVar Radiance Assimilation • CNTL: 3DVar Retrieval Assimilation • Data Configurations • TEST : ATOVS TBB from 120km BUFR • note: All HIRS and AMSU-14 radiances from NOAA15 are not used due to instrumental problems • CNTL: ATOVS NESDIS retrievals (BUFR + SATEM) • System • 6hourly intermittent data assimilation • forecast model : T106L40 (model top 0.4hPa) global spectral model, 216h forecasts for 12Z initial • analysis model : 3DVar Incremental method • 1 month run
Bias RMSE RMSE and Bias of Analysis/Guess verified against radiosonde N.H. • Temperature on the standard pressure levels from 1000 to 10 hPa • Case of 30th Jul 2001 Trp. Test Anal Cntl Anal Test Gues Cntl Gues S.H.
Bias RMSE Test Anal Cntl Anal Test Gues Cntl Gues RMSE and Bias of Analysis/Guess verified against radiosonde N.H. • Wind Speed on the standard pressure levels from 1000 to 10 hPa • Case of 30th Jul 2001 Trp. S.H.
Test Cntl Forecast Errors verified against radiosonde for 500hPa Z RMSE Bias N.H. • Improvements especially in the S.H. • But in the N.H. and Tropics, the improvements diminish beyond day 5 of the forecast. Trp. S.H.
Test Cntl Forecast Errors verified against radiosonde for 250hPa Wind Speed RMSE Bias N.H. • Nearly Neutral Impact on forecast Trp. S.H.
1hPa 10 3 1hPa 10hPa 10 10 100 100 -10 -3 90S 90N 90S 90N Averaged Zonal Mean for Forecast Error at day 5 and Analysis difference • Average during 13th - 29th Jul 2001 • Large systematic forecast errors around 10 hPa and above 3hPa, especially in the S.H. are obvious.The value is positive around 10hPa while negative above 3hPa. • Averaged analysis difference is also obvious. Unfortunately Test fits radiosonde worse than Cntl for the 10hPa temperature. Averaged Zonal Mean Forecast error (Fcst - Init ) at day 5 for temperature from 850 to 1 hPa Averaged Zonal Mean Analysis difference between Test and Cntl for temperature from 850 to 0.4 hPa
Conclusion and Plan • JMA global 3DVar started operationally since Sep. 2001. At the moment NESDIS and MSC thickness retrievals are assimilated. • The direct radiance assimilation system is being developed. QC, channel selection and bias correction are performed in the 1DVar pre-processing system. • Parallel assimilation experiments have been run. Some improvements for analyses and forecasts are given but are not found beyond day 5 of the forecast. • The problem can be attributed to QC, observation error assignment and data selection ( thinning ). Besides forecast systematic error in the stratosphere probably have something to do with it. • We have other plans to • assimilate AMSU-B radiance • improve QC • use level 1B data
AMSU-B Assimilation : initial results Accuracy of AMSU-B 1DVar products verified against radiosonde observations for specific humidity below 100 hPa Studying the impact of AMSU-B radiance on analysis and forecast RMSE Bias N.H. AMSU-B retrieval First Guess Trp. S.H.
Improve QC (1) • Detect clear/thin cloud/thick cloud/rain using only observation information (not guess) • The system is based on AAPP. • Cloud detection J = ( y-m )T C-1 ( y-m ) • y: TBob of HIRS1-4, 13-15, AMSU4-5 for thin cloud detection AMSU1-3 for thick cloud detection • m:average clear TBB , C: clear TBB covariance • designate as cloudy when J>J0 STD of clear TBob-TBbg over land Histogram of TBob-TBbg for HIRS8 over sea Clear Thin cloudy Thick Cloudy TBob-TBbg
Improve QC (2) • Rain detection : Scattering Index SI = TBcal(A15) - TBob(A15) • TBcal(A15) is calculated based on a statistical regression approach with predictors of AMSU1-3 • designate as rainy when SI > 10. • The threshold 10 is determined based on collocated TRMM TMI and PR rain TBob-TBbg STD of each HIRS and AMSU channel for clear/cloudy/rain over sea