Download
1 / 23
370 likes | 697 Vues
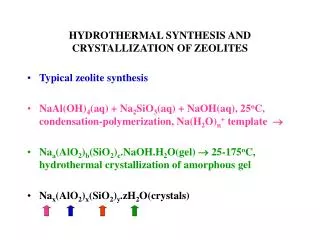
Chemical synthesis through oxidation of graphite[9-9]. I-4. (I) The Hummers Method Natural graphite flake (325 mesh) was mixed with H 2 SO 4 . Keep stirring in an ice-water bath. Addition of KMnO 4 and keep stirring at room temperature. Pour DI water and H 2 O 2 . Placed over night.

E N D
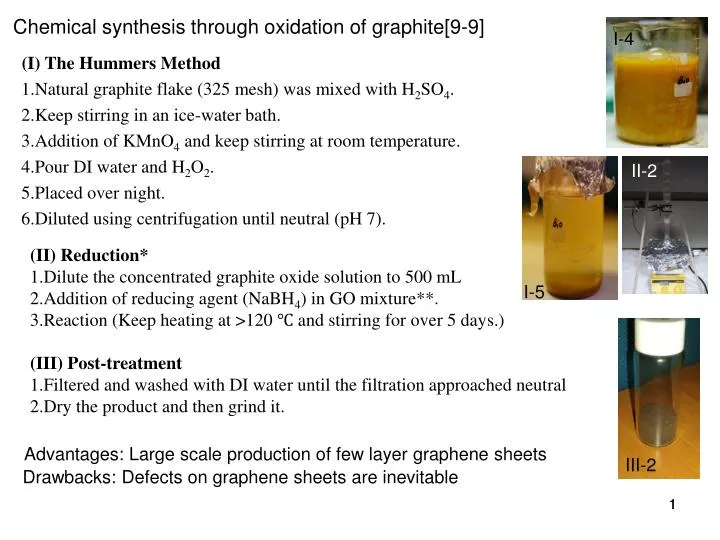
Chemical synthesis through oxidation of graphite[9-9] I-4 • (I) The Hummers Method • Natural graphite flake (325 mesh) was mixed with H2SO4. • Keep stirring in an ice-water bath. • Addition of KMnO4 and keep stirring at room temperature. • Pour DI water and H2O2. • Placed over night. • Diluted using centrifugation until neutral (pH 7). II-2 • (II) Reduction* • 1.Dilute the concentrated graphite oxide solution to 500 mL • 2.Addition of reducing agent (NaBH4) in GO mixture**. • 3.Reaction (Keep heating at >120 ℃ and stirring for over 5 days.) • (III) Post-treatment • 1.Filtered and washed with DI water until the filtration approached neutral • 2.Dry the product and then grind it. I-5 Advantages: Large scale production of few layer graphene sheets III-2 Drawbacks: Defects on graphene sheets are inevitable 1
Stankovich et al. proposed the following mechanism for reduction of graphene oxide using hydrazine. Reduction of graphene oxide restores electrical conductivity. However, significant oxygen content remains: C/O~ 10/1. *Reduction method Thermal or chemical reduction have been used to convert insulating GOs to conducting graphene-like layers. Thermal reduction has been highly effective in producing graphene-like films with a C:O ratio of up to 9 and minimal defect formation ※. Chemical reduction is very simple, but it usually generates graphene-like film exhibiting a relatively low C:O ratio and a considerable amount of residual functional groups, resulting in a highly resistive film. An alternative chemical reduction is dehydration of the hydroxyl groups on graphene oxide in water at high pressure and temperature, 120-200 C. Aluminum powder appears to catalyze this process in an acidic condition.(9-1) 2
**Adoption of NaBH4 and N2H4: When N2H4 was used, nitrogen atoms behaved as donors compensating p-type hole carriers in reduced graphite oxide. In the case of NaBH4 reduction, the interlayer distance is first slightly expanded by the formation of intermediate boron oxide complexes and then contracted by the gradual removal of carbonyl and hydroxyl groups along with the boron oxide complexes The sheet resistance of graphite oxide film reduced using sodium boro hydride (NaBH4) is much lower than that of films reduced using hydrazine (N2H4). 3
Processes of oxidation and reduction for graphene (B) (C) (D) (A) Graphite (3.38 A) (E) ↓ (B) Graphite oxide (GO, 8.27 A) (A) ↓ (C) Reduced GO (15 mM, 9.31 A) ↓ (D) Reduced bGO (50 mM, 9.72 A) ↓ (E) Reduced GO (150 mM, 3.73 A) : most of the functional groups were removed, 4
9.6 Thermal exfoliation and reduction [9-1] Thermally reduced graphene oxide (TRG) can be produced by rapid heating of dry GO under inert gas and high temperature. Heating GO in an inert environment at 1000 C for 30 s leads to reduction and exfoliation of GO, producing TRG sheets. Exfoliation takes place when the pressure generated by the gas (CO2) evolved due to the decomposition of the epoxy and hydroxyl sites of GO exceeds van der waals forces holding the graphene oxide sheets together. About 30% weight loss is associated with the decomposition of the oxygen groups and evaporation of water. The exfoliation leads to volume expansion of 100-300 times producing very low-bulk density TRG sheets (Figure 5d) Because of the structural defects caused by the loss of CO2, these sheets are highly wrinkled as shown in Figure 5e. 5 Fig. 5 e Fig. 5 d
80% of the TRG sheets are single layers with an average size of about 500 nm independent of the starting GO size. The advantage of the thermal reduction methods is the ability to produce chemically modified graphene sheets without the need for dispersion in a solvent. TRG has C/O ratio of about 10/1 compared to 2/1 for GO. This ratio has been increased up to 660/1 through heat treatment at higher temperature (1500 C) or for longer time. TRG sheets have high surface area, 1700 m2/g, as measured in methylene blue and can be well dispersed in organic solvents such as N,N-dimethylformamide (DMF) and tetrahydrofuran (THF). 6
DC bias 9.7 Electrolytic exfoliation [9-2] Facility: 1.Power supply Materials: 1.High purity graphite rods 2.Poly(sodium-4-styrenesulfonate)(PSS) 3.De-ionized (DI) water Graphite rod Graphite rod Processes: 1.Apply constant potential of 5V 2.Dispersion subjected to centrifuge 3.Wash with DI water and ethanol 4.Dried to make powder 5.Vacuum filtration using AAO to obtain graphene paper Electrolyte Mechanism: When PSS dissolved in water, it will dissociate into Na+ cations and polystyrene- sulfonate anions. During the electrolysis process, polystyrenesulfonate anions were forced to move to the positive graphite electrode under electric force and interact with graphite, leading to the electrolysis exfoliation of the graphite rod. Primary advantages and drawbacks A: Simple D: Dispersions are difficulty to remove
9.8 Characterization 9.8.1 X-ray diffraction 9.8.2 FTIR 9.8.3 Raman 9.8.4 AFM 9.8.5 FE-SEM, TEM and HRTEM 9.8.6 X-ray photoemission spectroscopy (XPS) 8
(A) Graphite (3.38 A) (B) Graphite oxide (GO, 8.27 A) (C) Reduced GO (15 mM, 9.31 A) (D) Reduced bGO (50 mM, 9.72 A) (E) Reduced GO (150 mM, 3.73 A) : most of the functional groups were removed. 9.8.1 X-ray diffraction (9-14, 9-16) (B) (C) (D) (E) (A) XRD spectrum shows that the interlayer distance of the r-GO film is decreased to 3.57A° (2h = 24.4) from 8.10A° (2h = 10.9) for the original GO film.(9-14)
The d-spacing of graphite sharp feature peak (002) at 26.38 is 3.38A°. The GO feature peak at 9.26, whose corresponding d-spacing is 9.55A°, disappears when the reducing temperature increases above 80 C, which indicates that most of the oxygen functional groups, having marked effects on the d-spacing, have been reduced above 80C (9-16). The feature peaks (002) of the RGO reduced for 0.25–3 h almost have no shift, which indicates that the content of carbonyl and epoxy in GO or RGO is the main factor that affects the d-spacing values of GO and RGO, combined with the changes of the relative contents of carbonyl (C=O), epoxy (C–O–C), and hydroxyl (C–OH) bonds in GO and RGO (9-16). 10
9.8.2 FTIR The peaks at 1060, 1186, 1226, 1290,1720, 1640, 1620, 1566, and 1393 cm-1 are assigned to the stretching vibration of C–O (alkoxy), phenolic OH, C–O (epoxy), C–OH bending, C=O, aromatic C–C, Ph–CO, deformed C–C, C–OH, respectively. The deformed C–C stretching vibration at 1566 cm-1 is due to the presence of the neighboring epoxy groups. The peaks (1060–1290 cm-1) corresponding to oxygen functional groups dramatically decrease with increasing the reducing temperatures from 80 to 140 C in Fig. 2a and with increasing the reducing time from 0.25 to 3 h in Fig. 2c. The C=O peak at 1720 cm-1 in Fig. 2b disappears when the reducing temperature is above 55 C, while the Ph–CO and C–OH peaks in Fig. 2b have no obvious changes at different reducing temperatures. In addition, the C=O peak in Fig. 2c completely disappears until the reducing time reaches 3 h. The deformed C–C peak at 1566 cm-1 in Fig. 2c decreases with increasing the reducing time and the aromatic C–C at 1640 cm1 simultaneously increases, indicating that the GO is gradually reduced into graphene. (9-16) 11
9.8.3 Raman: Non-destructive technique to characterize graphite materials in particular to determine the defects, ordered and disordered structure of graphene. Excited state(激發態) Vibrated state(振動態) Ground state(基態) Raman scattering or the Raman effect is the inelastic scattering of a photon. When photons are scattered from an atom or molecule, most photons are elastically scattered (Rayleigh scattering), such that the scattered photons have the same kinetic energy (frequency and wavelength) as the incident photons. However, a small fraction of the scattered photons (approximately 1 in 10 million) are scattered by an excitation, with the scattered photons having a frequency different from, and usually lower than, that of the incident photons. (Wikipedia)
In Wang’s work[9-3], they proposed a mild exfoliation-reintercalation expansion method for forming high-quality GS with higher conductivity and a lower degree of oxidation than GO. Here we present a 180 °C solvothermal reduction method for our GS and GO. The solvothermal reduction is more effective than the earlier reduction methods in lowering the oxygen and defect levels in GS, increasing the graphene domains, and bringing the conductivity of GS close to that of pristine graphene. The reduced GS possess the highest degree of pristinity among chemically derived graphene. D: Defect peak due to intervalley scattering G: Graphene G peak D’: Defect peak due to intervalley scattering 2D: Overtone of D peak S3:Second-order peak due to D-G combination Wang JACS 2009 9910
The D/G intensity ratios increase from GO to the RGO reduced at 100 C, decrease for the RGO reduced from 100 to 140 C, and increase again for the RGO reduced from 140 to 150 C. The first increase stage of the D/G intensity ratios is attributed to an increase in the number of small crystalline graphene domains, the next decrease is due to an increase of the average size of the crystalline graphene domains with increasing the reducing temperatures, and the last increase of the D/G intensity ratios at 150 C is resulted from the decrease of reducing ability of NaBH4 with Anhydrous AlCl3 because of over high reducing temperature. 14
9.8.4 AFM (9-2, 9-6) Contact mode (contact between probe and surface) Non-contact mode (van der Waals force, signal amplified) Tapping mode (reduce distance between probe and surface, enlarge amplitude, probe contact surface at the valley of vibration) A zoomed image of graphene flakes. Below the image is a line scan taken horizontally through the image as marked with a red line, from which the height of a small graphene flake and a large graphene flake were determined to be about 0.8 nm, indicating the monolayer graphene sheet. AFM images of spray deposited graphene flakes. (9-2)
9.8.4 AFM (9-2, 9-6) (a)-(c) OM image of Cu foil surface after being annealed at 990 C, 80 mbar for 20 min, and it can be observed that there are a lot of ‘‘polishing marks’’ on the Cu surface even after the annealing at 990 C. (9-6) (d)-(f)low pressure annealing could greatly enhance the uniformity of Cu surface and decrease the number of the sharp structures, thereby making the Cu surface smoother. (9-6) 16
9.8.5 FE-SEM, TEM and HRTEM[9-6] (a) TEM image of CVD bilayer graphene (area containing the purple ring) on Cu grid. (b) Electron diffraction patterns taken within the purple ring in (a). (c) High resolution transmission electron microscopy (HRTEM) image of bilayer graphene. Red lines are along the direction of the carbon lattice atoms, which also indicates the existence of different orientations. (9-6) 17
Fig. 3a shows a FESEM image of the graphene nanosheets. The morphology of individual graphene sheets resembles waves in a crumpled silk veil. The graphene sheets look transparent under the electron microscope. (9-2) Fig. 3b shows a low magnification TEM image of graphene sheets. Most of the graphene sheets are stacked multilayers. These graphene sheets are rippled and entangled. (9-2) Well diluted graphene dispersion was also prepared for TEM analysis. Fig. 3c shows a TEM view of a few flat graph ne sheets in larger sizes (a few square micrometers), in which about 2–3 layers of graphene overlap. Selected area electron diffraction (SAED) was performed on the graphene sheets and the corresponding SAED pattern is shown as the inset in Fig. 3c. (9-2) 18
9.8.6 X-ray photoelectron spectroscopy* (9-13) X-ray photoelectron spectroscopy (XPS) is a quantitative spectroscopic technique that measures the elemental composition, empirical formula, chemical state and electronic state of the elements that exist within a material. XPS spectra are obtained by irradiating a material with a beam of X-rays while simultaneously measuring the Kinetic energy and number of electrons that escape from the top 1 to 10 nm of the material being analyzed. XPS requires ultra-high vacuum (UHV) conditions.* 19
C-O, hydroxyl and epoxy (~286.5 eV) C=O, carbonxy (~288.3 eV) C=C/C-C (284.6 eV) O-C=O, carboxyl (~290.3 eV) Boron oxide complexes were visible in films treated with 15mM NaBH4 15 mM: carboxyl groups were partially removed 50 mM: all of the carbonyl groups were nearly removed and CO bonds were reduced . 150 mM: No significant reduction of the oxygen- related functional groups.
The UV-vis spectra of GO and three RGO films showed the absorption peak of GO around 230nm gradually red-shifting towards 260nm in films treated with higher concentrations of NaBH4. The peaks of GO at 300 and 360nm evidently disappeared. This indicated the formation of highly conjugated structure like that of graphite.
Conductivity relies on C:O ratio as a function of the molar concentration of NaBH4. The behavior of the conductivity and C:O ratio were very similar to each other the NaBH4 concentration. Conductivity of the film was directly related to the oxygen content. Complete removal of residual oxygen content even when using high NaBH4 concentrations was the key factor in further reducing the sheet resistance. The presence of oxygen atoms also affects the electronic density of states, as shown in Figure 4b.
* Wikipedia 9-1. Macromolecules, Kim 2010 43 6515 (also 10-5) 9-2. Carbon, Wang 2009 3242 9-3. JACS, Wang 2009 9910 9-4. Nature Nanotechnology 2009 4 30 9-5 Science 2004 306 666 9-6 Carbon, Wei Liu 2011 9-7 Nature, Kim 2009 9-8 Science, Berger 2006 312 1191 9-9 Carbon, Ma 2011 49 1550 9-10 NTT Technical Review, Hibino 2010 8 8 1 9-11 Progress in Materials Science, Singh 2011 56 8 9-12 Nature Materials, Emtsev 2009 8 203 9-13 PRL, Ferrari 2006 97 187401 9-14 Advanced Functional Materials, Shin 2009 19 1987 9-15 Carbon Pei 2010 4466 9-16 Carbon Li 2011 3024 9-17 Macromolecular Chemistry and Physics, Du 2012 213 1060 (also 10-6) 9-18 Carbon Stankovich 2007 45 1558–1565 23