Download
1 / 19
190 likes | 386 Vues
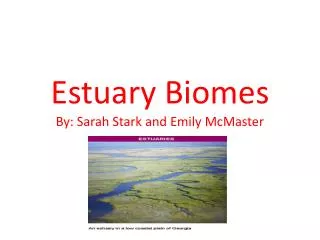
The Virtual Estuary: Simulation meets Visualization. Erik Anderson Joel Daniels Juliana Freire Claudio Silva. Yvette Spitz Scott Durski. Antonio Baptista Joseph Zhang. CMOP: Making Sense of Data. Five-component ecosystem model. SELFE – Unstructured grid. Phytoplankton. Nitrate.

E N D
The Virtual Estuary: Simulation meets Visualization Erik Anderson Joel Daniels Juliana Freire Claudio Silva Yvette Spitz Scott Durski Antonio Baptista Joseph Zhang
CMOP: Making Sense of Data • Five-component ecosystem model SELFE – Unstructured grid Phytoplankton Nitrate Spitz et al. (2005) Ammonium Nodes: 27624, Elements: 53369 Vertical levels: 54 50 km Zooplankton Detritus • Model of Myrionecta Rubra: 7 components ROMS – Structured grid • Other possible model: 12 components km Grid pts: 384x128 Vert. levels: 44 km
CMOP: Making Sense of Data • Observation and modeling of multiple systems at multiple scales • Scientists need to collaborate: biologists, chemists, oceanographers, computer scientists • Very large number of data products, sensor measurements, and results from numerical models • Cover more than 10 years of experiments: occupy over 30 TB of storage
CMOP Cyberinfrastructure • Support key activities in the CMOP collaboratory: from data acquisition and visualization to result dissemination • VisTrails is a scientific workflow system • Integrate simulations, data pre-processing, and analysis • Focus on exploratory tasks such as visualization and data mining • Transparently tracks provenance of the discovery process---the trail followed as users generate and test hypotheses • Supports result dissemination through publishing and teaching Open-source: http://www.vistrails.org
VisTrails: Provenance of Exploration Reproducibility and Validation Collaboration Knowledge sharing: data + processes
Benefits of Provenance • Compare data products • Assess data quality, understand process • Support for reflective reasoning • Improve training and teaching “Reflective reasoning requires the ability to store temporary results, to make inferences from stored knowledge, and to follow chains of reasoning backward and forward, sometimes backtracking when a promising line of thought proves to be unfruitful. …the process is slow and laborious” Donald A. Norman [Freire et al., IPAW 2006]
Benefits of Provenance • Compare data products • Support for reflective reasoning • Improve training and teaching • Knowledge re-use • Provide suggestions to users as they construct visualizations [Koop et al., IEEE Vis 2008]
Visualization at large and on the go Rendering of the Columbia River on an IPOD Touch High- resolution rendering of the Columbia River virtual estuary at a display wall
VisTrails: Science Dissemination • Science mashups: simplify data exploration through visualization http://www.vistrails.org/vismashup/main.html [Santos et al., IEEE Vis 2009]
VisTrails: Science Dissemination • Teaching and training • Lecture provenance: student can reproduce results • Homework provenance: provides insights regarding ask complexity and nature, student confusion • VisTrails has been adopted as a teaching tool at Utah, UNC, UTEP, Linkoping (Sweden)
VisTrails: Science Dissemination • Provenance-rich documents and publications http://www.vistrails.org/index.php/Viswiki
The Importance of Visualization: Research • A picture is worth a thousand words! • Understand large volumes of simulation results---obtain insights • Identify interesting features • Correlate information from multiple models • Interactively explore data • Flow visualization
The Importance of Visualization: Education • Intuitive representation, easier for non-experts to understand • Visually appealing • Teaching and outreach: encourage students and general public to learn about science
Conclusions and Future Work • Visualization is essential for ocean observatories • VisTrails and Provenance • Support reflective reasoning • Intuitive interfaces for simplifying the construction and refinement of visualizations • Sharing provenance creates new opportunities • Workflow/provenance repositories; provenance-enabled publications • Expose scientists to different techniques and tools • Scientists can learn by example; expedite their scientific training; and potentially reduce their time to insight Provenance + Workflows + Sharing have the potential to revolutionize science!
Acknowledgments • Thanks to: • VisTrails group • CMOP cyber and modeling teams
VisTrails: Parameter Exploration • Conveniently explore parameter spaces and compare results [Freire et al., IPAW 2006]
Provenance Enabling Tools [Callahan et al., IPAW 2008]
VisComplete [Koop et al., IEEE Vis 2008]