Download
1 / 45
470 likes | 654 Vues
Sound and Light in Seawater Radiation Balance. September 3. T-S Diagram. Density ( σ t ) is less for warmer, fresher water Various water masses can be distinguished by its temperature and salinity characteristics, which helps trace the origin of water masses

E N D
Sound and Light in SeawaterRadiation Balance September 3
T-S Diagram • Density (σt) is less for warmer, fresher water • Various water masses can be distinguished by its temperature and salinity characteristics, which helps trace the origin of water masses • σθ and σt vary rapidly with temp. at high temp. at all salinities • σt varies more slowly with temp. at low temp. and low salinities
Identifying water masses • Temperature and Salinity are conservative properties • θ (potential temperature) is conservative • T (in situ) is not, it changes with pressure
Figure from http://www.es.flinders.edu.au/~mattom/ShelfCoast/notes/figures/fig10a1.html
Sound in Seawater • Sound travels as pressure wave – compression waves:
Phase Speed C Frequency f Angular frequency w Wave Number k Wave Lengthl Sound spreads equally in all directions in homogeneous water Sound decays due to: - spreading loss - attenuation – absorption and scattering; absorption depends on frequency
- β: adiabatic compressibility • - C de/increases because ρ and β de/increase • C de/increases by: • 3 m s-1 /K temperature de/increase (ρ decreases) • 1.4 m s-1 / 1‰ salinity increase • 17 m s-1 / 1000m depth de/increase
Specific Volume • α: Volume/unit mass • α= α(S,T,P) • If ρ increases, α decreases • in upper ocean, C is determined primarily by Temperature (and salinity to a lesser degree) • in deeper ocean, C is determined by pressure
Speed does not depend on frequency • f =10 KHz → λ = 0.14 m • f =100 KHz → λ = 0.014 m = 14 mm • Sonars and echo sounders operate in this range • Spreading loss in sound channel is proportional to distance traveled
Sound absorption is due primarily to viscosity: I: sound intensity r: distance along ray path Beer’s Law – Loss proportional to energy present higher frequencies → shorter wavelength → stronger absorption SO, low frequency sound can travel very far in sound channel
Exponential Decay – you will see this again! 1/k : e-folding scale – scale at which concentration is 1/e of it’s initial value see http://en.wikipedia.org/wiki/Exponential_decay C = C0 e –kx - solution to dC/dx = -kC(x) – rate of change depends on concentration
Sound refracted Downward Sound Channel Sound refracted Upward Figure 3.15 in Stewart
Sound Channel aka SOFAR Channel Figure 3.16 (Stewart): Sound emitted near axis of sound channel is focused along axis – low frequencies can travel many thousands of kilometers
Acoustic Thermometry of Ocean Climate (ATOC) is a program began by Walter Munk to observe the state of the world's ocean climate using long-range acoustic transmissions The ATOC prototype array was an acoustic source located just north of Kauai, Hawaii, and transmissions were made to receivers of opportunity in the North Pacific Basin. (from http://en.wikipedia.org/wiki/Acoustic_thermometry)
Winds over the Ocean Figure 4.2 (Stewart): Map of mean annual sea-level pressure calculated from the ECMWF 40-year reanalysis. From From Kallberg et al 2005. Wind blows along contours of pressure (except near Equator) – closer contours mean stronger wind – Geostrophic Balance
Figure 4.3(a) (Stewart): Simplified schematic of Earth's atmospheric circulation driven by solar heating in the tropics and cooling at high latitudes. The meridional cells in the atmosphere and the influence of Earth's rotation on the winds. From The Open University (1989a).
Figure 4.3(b) (Stewart): Simplified schematic of Earth's atmospheric circulation driven by solar heating in the tropics and cooling at high latitudes. Cross-section through the atmosphere showing the two major cells of meridional circulation. From The Open University (1989a).
Wind Stress The force of the wind, or the work done by the wind on the sea surface: called the wind stress - the vertical transfer of horizontal momentum from the atmosphere to the ocean Wind stress t is calculated from: t = ρ CD U210 where ρ= 1.3 kg/m3 is the density of air, U10 is wind speed at 10 meters, and CD is the drag coefficient CD is approximately 1 x 10⁻³ to 3 x 10⁻³ and varies with wind speed (see text) Bulk Aerodynamic Formulation
What Do We Get From the Sun? Keep in mind that this is the ultimate energy source for nearly all of the variability that we have in the ocean and atmosphere. First let’s look at some numbers : Solar constant, S = 1376 W/m2 3.5% (max in Jan) Total energy rec’d = R2 S = 1.75 x 10¹⁷ W Average energy / unit area = total / surface area = S/4 (area of a sphere = 4R2) = 344 W/m2 Albedo (amount reflected or scattered) averages about 0.3 (range 0.1 – 0.6, tropics – Antarctica), so average energy / unit area received = 240 W/m2 from Gary Mitchum 2006
Figure 5.2 (Stewart): Insolation (spectral irradiance) of sunlight at top of the atmosphere and at the sea surface on a clear day. The dashed line is the best-fitting curve of blackbody radiation the size and distance of the sun. The number of standard atmospheric masses is designated by m. Thus m = 2 is applicable for sunlight when the sun is 30° above the horizon. From Stewart (1985).
Figure 5.3 (Stewart): Monthly average of clear-sky, downward flux of sunlight through the sea surface in W/m2 during 1989 calculated by the Satellite Data Analysis Center at the NASA Langley Research Center (Darnell et al., 1992) using data from the International Satellite Cloud Climatology Project.
Physics of Radiation (Stefan’s Law) from Gary Mitchum 2006
Physics of Radiation (Wien’s Law) from Gary Mitchum 2006
Wien’s Law and Energy Spectra T = 6000 K (The Sun) from Gary Mitchum 2006
The Simplest Balance Suppose we have a solid planet (no atmosphere) that receives 300 W/m2 at its equator. What should the temperature be based on the physics we’ve introduced thus far? • If we’ve reached steady state, then the planet must be radiating as much energy as it receives; i.e., it must radiate 300 W/m2 . And if it radiates as a blackbody, then we can compute the temperature from • T4 = 300 W/m2 which gives T = 270 K = -3 C COLD!! If we do this at the poles, T is less than –100 C ! Well, clearly we’re missing something. Let’s put on an atmosphere. from Gary Mitchum 2006
The Greenhouse Effect – Basic Idea We think of the atmosphere as a sheet of glass that lets all of the Sun’s short wave energy go through. But our glass atmosphere absorbs a fraction (call it e) of the long wave radiation. Also, our model atmosphere emits long wave radiation in all directions at a rate proportional to its temperature. Let’s sketch this situation and see what the predicted temperature of the Earth would be. from Gary Mitchum 2006
The Greenhouse Effect – Calculating the Temperature I = (1 - e) U + B I + B = U I and e are known, which means we can solve for U and B, which means we can solve for the ground temperature from U. For e = 1, T = 50 C at equator too hot For e = ½ , T = 19 C at equator too cold, but closer. from Gary Mitchum 2006
The Greenhouse Effect – The Real World Note all the ways clouds enter in. Cloud physics is one of the biggest challenges in predicting future climate change. from Gary Mitchum 2006
Radiation at the Sea Surface – Incoming Short Wave from Gary Mitchum 2006
Radiation at the Sea Surface – Outgoing Long Wave from Gary Mitchum 2006
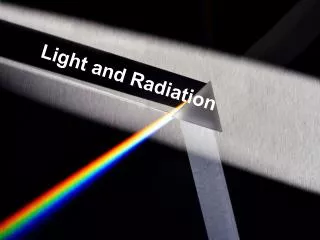
Solar Radiation in the Sea • Short-wave – incoming k = Vertical attenuation coefficient k = k(λ) : depends on wavelength – smallest for blue light - Reds are longer absorbed in upper meter or less – gives up heat to water
Figure 6.17 (Stewart): Absorption coefficient for pure water as a function of wavelength λ of the radiation. Redrawn from Morel (1974: 18, 19).
Figure 6.18 (Stewart): Left: Attenuation of daylight in the ocean in % per meter as a function of wavelength. I: extremely pure ocean water; II: turbid tropical-subtropical water; III: mid-latitude water; 1-9: coastal waters of increasing turbidity. Incidence angle is 90° for the first three cases, 45° for the other cases. Right: Percentage of 465nm light reaching indicated depths for the same types of water. From Jerlov (1976).
Figure 6.19 (Stewart): Spectral reflectance of sea water observed from an aircraft flying at 305m over waters of different colors in the Northwest Atlantic. The numerical values are the average chlorophyll concentration in the euphotic (sunlit) zone in units of mg/m3. The reflectance is for vertically polarized light observed at Brewster’s angle of 53°. This angle minimizes reflected skylight and emphasizes the light from below the sea surface. From Clarke, Ewing, and Lorenzen (1970). Can compute Chl by looking at ratio of different wavelengths
Average ocean chlorophyll concentration measured by SeaWiFS since launch from http://earthobservatory.nasa.gov/Newsroom/NewImages/