Download
1 / 19
190 likes | 329 Vues
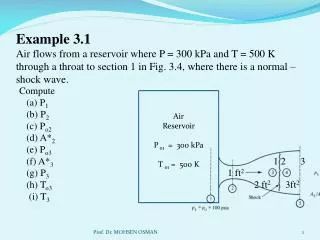
Measurement and Modeling of Reduced Sulfur Compound Emissions from Concentrated Animal Feeding Operations. Ian C. Rumsey 1 , Viney P. Aneja 1 , and William A. Lonneman 2. 1 Department of Marine, Earth and Atmospheric Sciences North Carolina State University

E N D
Measurement and Modeling of Reduced Sulfur Compound Emissions from Concentrated Animal Feeding Operations Ian C. Rumsey1, Viney P. Aneja1, and William A. Lonneman2 1Department of Marine, Earth and Atmospheric Sciences North Carolina State University Raleigh, NC 27695-8208, U.S.A 2 Senior Environmental Employment Program, US Environmental Protection Agency, Research Triangle Park, NC,27711, U.S.A
Introduction Concentrated Animal Feeding Operations (CAFOs) in North Carolina Method and Materials - Emission measurements Results Magnitude of reduced sulfur compounds (RSCs) emissions Modeling of H2S emissions from manure surfaces Conclusions Outline
Introduction • Red dot = Hog Farm Virginia Raleigh Tennessee South Carolina Atlantic Ocean • In North Carolina, the primary CAFO is the hog industry, producing revenues of over $2 Billion per year • ~ two-thirds of 10 million hog population in a six county region
Environmental Impacts • Local Scale • RSCs have a unpleasant odor and a low odor threshold • Unpleasant odors can effect quality of life and lead to the development of health symptoms and health effects • Schiffman and Williams, (2005) identify two community investigations, where there are reported health effects from an average daily exposure of 10-11 ppb of H2S • Regional Scale • RSCs contribute to formation of aerosols such as ammonium sulfate and ammonium bi-sulfate • Inhalation of small particles can result in damage to lungs, decrease visibility and scatter incoming radiation, resulting in regional cooling
ResearchObjectives • To measure and analyze the emissions of reduced sulfur compounds from a CAFO hog farm • To develop a process-based model to predict H2S emissions from manure surfaces Methods and Materials- Sampling Scheme • Continuous H2S measurements were made in-situ by a pulsed fluorescence H2S/SO2 analyzer • Other RSCs analyzed ex-situ by Gas Chromatography Flame Ionization Detection (GC-FID)
Methods and Materials- Sampling Scheme • Lagoon emission measurements are made using a dynamic-flow through chamber system interfaced to a mobile laboratory for about one week per season • 4 sampling seasons in total • Aqueous waste samples taken daily from the lagoon and analyzed for sulfide. Lagoon temperature and pH also measured. • Barn emission measurements were made by placing a sample line at one of the barn exhaust fans for about one week per season • Barn temperature measured • Meteorological measurements
Flux Measurements- Lagoon Meteorological Tower Mobile Laboratory Van Zero Air Continuous Duty Motor Vent Line Flow Controller Outflow Impeller Stirrer Inflow PVC Floating Platform pH Probe Lagoon Temperature Probe #1
Steady State Lagoon Flux Calculation J = Flux (μg m-2 min-1) Cfinal = Concentration of compound (μgm-3) L = Loss term (m min-1) ATotal= Total area of internal chamber (m2) V= Volume of chamber above water (m3) Q= Flow rate of carrier gas through chamber (m3 min-1) H= Internal height of chamber (m)
Barn Emissions Calculation J = Cgas *ΣF J = Emission rate (μg min-1) Cgas = Gas concentration measured at fan outlet (μg m-3) Σ F = Sum of all calculated fan flow rates (m3 min-1)
RSCs measurements • Whole air samples were collected using 6 L SUMMA and Fused Silica Lined canisters (FSL) • For both lagoon and barn, 10-12 samples were taken each • Analyzed by Gas Chromatography • Flame Ionized Detector (FID), detect compounds containing a carbon-hydrogen bond, includes the target RSCs, dimethyl sulfide (DMS), dimethyl disulfide (DMDS), and methyl mercaptan
Results- Lagoon Fluxes • Methyl Mercaptan not identified in any canister samples • H2S flux an order of magnitude higher than DMS and DMDS flux in summer and fall • H2S lagoon flux measurements are similar to a North Carolina study, however generally they are two orders of magnitude lower than other U.S studies measuring lagoon fluxes at hog CAFOs • No previous DMS and DMDS lagoon emission studies
Barn Concentrations a Devos et al.(1990), b Haz-Map (2009) c American Industrial Hygiene Association. (1989), d Rychlik et al.(1998) e Schiffman and Williams, (2005) • H2S concentrations were generally 1-2 orders of magnitude higher than the odor threshold • No DMS concentrations exceeded any odor threshold • DMDS concentrations in the fall have an average concentration exceeding the lowest odor thresholds • Concentrations are of a similar order of magnitude to other studies
RSC Barn Emissions • H2S emissions are two orders of magnitude higher than DMS and DMDS emissions • H2S emissions are of similar magnitude to other H2S hog CAFO emission studies • DMS and DMDS emissions are approximately an order of magnitude lower than the only other reported emissions from South Korea
North Carolina RSCs Emissions • Using SPOT satellite image, average size of lagoon is ~ 1ha (Aneja et al, (2000) • ~ 2600 hog CAFOs in North Carolina • NC Barn emissions calculated using statistics provided by USDA. • NC Division of Air Quality published an H2S emission inventory in 2002, stating total emissions of ~ 11.9 million lbs yr-1, not including animal emissions • Hogs CAFOs comprise ~ 22% of statewide H2S emissions
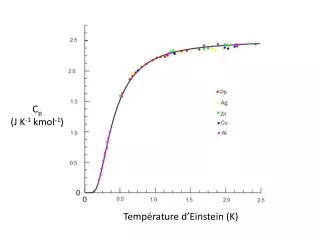
Modeling of H2S emissions from manure surfaces • H2S emissions from manure surfaces vary with production, management and environmental conditions, therefore a process based model is needed to predict emissions • A process based air-surface interface mass transfer model with chemical reactions was developed • 1) H2S flux= hm [H2S]gas 2) [H2S]manure↔[H2S]gas • Three main components of the model • 1) Mass transfer coefficient (hm), 2) Henry’s law constant (Kh) • 3) Dissociation constant • Different approaches used to calculate these components • Preliminary analysis shows model predicted fluxes to compare well to measured lagoon flux values Kh
Conclusions • H2S lagoon fluxes were up to an order of magnitude higher than DMS and DMDS fluxes • H2S barn concentrations were generally 1-2 orders of magnitude higher than the odor threshold • H2S barn emissions were two orders of magnitude higher than DMS and DMDS emissions • H2S emissions from hog CAFOs comprise ~22% of total North Carolina H2S emissions • A process based air-surface interface mass transfer model with chemical reactions was developed to predict H2S emissions from manure surfaces. Preliminary analysis shows model predicted fluxes to compare well to measured flux values
Acknowledgements • USDA as part of the National Research Initiative (NRI) under contract No. 2003-05360 • US EPA for the use of their analytical system • Mark Yirka and Joette Stiger of the North Carolina Division of Air Quality • Brian Baldelli of Machine and Welding Specialty Gases (MWSC) • NCSU Air Quality Research Group
Measurement and Modeling of Reduced Sulfur Compound Emissions from Concentrated Animal Feeding Operations Ian C. Rumsey1, Viney P. Aneja1, and William A. Lonneman2 1Department of Marine, Earth and Atmospheric Sciences North Carolina State University Raleigh, NC 27695-8208, U.S.A 2 Senior Environmental Employment Program, US Environmental Protection Agency, Research Triangle Park, NC,27711, U.S.A