Download
1 / 44
680 likes | 2.14k Vues
© G Schellack; 2012. Introduction to the 12-lead ECG. Gustav Schellack SASOCP Workshop 10 March 2012. Electrocardiogram (ECG). The ECG is a graphic recording of the electrical activity of the heart, at a specific moment in time.

E N D
© G Schellack; 2012 Introduction to the 12-lead ECG Gustav Schellack SASOCP Workshop 10 March 2012
Electrocardiogram (ECG) • The ECG is a graphic recording of the electrical activity of the heart, at a specific moment in time. • Note: ‘Electrical activity’ refers to the depolarisation and repolarisation of the atria and ventricles. • Note: The ECG cannot tell us anything about the ‘mechanical activity’ (i.e. contraction and relaxation) of the myocardium.
Anatomical orientation: Figure 1: (Marquette Electronics, 1996) (From: Yanowitz, FG. The Alan E Lindsay ECG Learning Centre in Cyberspace [homepage on the Internet]. c2012. Available from: http://library.med.utah.edu/kw/ecg/index.html.) Cardiac Conduction System
The Cardiac Impulse Spreads through both atria [virtually] simultaneously RA Originates from the SA-node (in the RA) Reaches the AV-node (where it is momentarily delayed) Spreads through both atria [virtually] simultaneously LA Enters the Bundle of His and the right and left bundle branches RBB Enters the Bundle of His and the right and left bundle branches LBB Activates both ventricles via the His-Purkinje network; first the septum from (L) to (R), then the RV, then the LV, and finally the apex Repolarisation of the ventricles (note that the repolarisation of the atria is obscuredby the depolarisation of the ventricles)
The Cardiac Impulse SA-node Bachmann’s bundle Ca2+ AV-node Ca2+ Internodal pathways Bundle of His Right atrium (RA) Bundle branches Figure 2: Diagram of the functional SA- and AV-nodes © G Schellack, 2012
The Standard 12-lead ECG You have each received a copy of this ECG… What is missing in this blank space? • This space should contain the following information: • Patient identifiers (e.g. name, hospital number, treating physician, etc.) • Date and time that the ECG was obtained • Vital signs, including BP and HR • Comment on any relevant symptoms (e.g. chest pain), cardiovascular drugs and special lead placements…
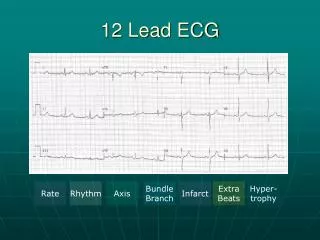
The Standard 12-lead ECG • The 12 leads are: • Six limb leads (I, II, III, aVR, aVL and aVF) • Six precordial (chest) leads: V1 to V6 • The 12 leads are displayed at a standardised tracing speed of 25 mm per second, and with 1 cm representing 1.0 mV on the vertical axis. • Check the calibration mark.
The Standard 12-lead ECG Criteria: • Standardisation: 10 mm in height = 1 mV; 25 mm per second. • Double and half-standardisation may be required. • Sinus rhythm: • Each P-wave must be followed by a QRS-complex, and vice versa. • RR-intervals must be constant (or ≤ than 0.12 s of physiological variance). • Normal heart rate (60-100 beats per minute). • Normal PR-interval (0.12 to 0.2 s in duration). • P-waves: Examine for normality in Lead I, II and V1. • QRS-complexes: Must be ‘positive’ in Lead I, II, III, aVF and aVL, and ‘negative’ in aVR. • Narrow QRS-complexes (0.08 to 0.12 s in duration); Q-waves in V5 and V6 are < 0.04 s and < 3 mm deep. • R-S-wave progression from V1 to V6; QTc-interval is normal. • Normal cardiac axis: Positive QRS-complexes in Lead I, III and aVF. • Normal ST-segments and T-waves.
Lead I - + RA - - LA aVR (+) aVL (+) Lead III Lead II aVF (+) + + LL Limb Lead Placement andEinthoven’s Triangle
Limb Lead Placement andEinthoven’s Triangle (From: Yanowitz, FG. The Alan E Lindsay ECG Learning Centre in Cyberspace [homepage on the Internet]. c2012. Available from: http://library.med.utah.edu/kw/ecg/index.html.)
Limb Lead Placement andEinthoven’s Triangle (From: Yanowitz, FG. The Alan E Lindsay ECG Learning Centre in Cyberspace [homepage on the Internet]. c2012. Available from: http://library.med.utah.edu/kw/ecg/index.html.)
Anterior axillary Midaxillary Midclavicular Transverse plane Antero-lateral view Placement of the Six Chest Leads
Important clinical considerations Correct lead-placement and good skin contact are essential. Avoid electrical interference (machine to be earthed). Compare serial tracings, if available. Relate any changes to age, gender, clinical history, etc. Consider co-morbidities and intercurrent illnesses that may have an effect on the ECG. For thermal paper: Obtain a photocopy for future reference. Interpret the ECG systematically to avoid errors.
The Standard 12-lead ECG[5/5] What/where are the 12 leads? 3 Augmented (unipolar) limb leads [aVR, aVL and a VF] 3 Standard (bipolar) limb leads [I, II and III] 6 Precordial (chest) leads [V1 to V6] Calibration mark
0.04 s (1 1) mm2 0.1 mV ECG Graph Paper Voltage (millivolts; mV) y x’ x Time (seconds; s) Question: What would the bigger square, i.e. the (5 5) mm2, represent? Answer: 0.2 s on the x-axis; 0.5 mV on the y-axis. y’
Deflections on the ECG R QRS-complex (qRs) P-wave T-wave U-wave Q (q) S (s)
ST-segment J-point PR-interval Isoelectric (base) line [0 mV] QT-interval Segments and Intervals on the ECG QRS-duration
PR-interval The P-wave P-wave • Conduction through the Right Atrium (RA) • Conduction through the Left Atrium (LA) • Conduction through the His-Purkinje network PR-interval:Represents the depolarisation of the atria and the time it takes for the impulse to spread from the SA-node, through the AV-junction, the bundle of His, and to the bundle branches.
Drawing an Isoelectric Baseline Why do we need to do this? [A portion of the rhythm strip.]
Rate Determination: First R-wave Next R-wave 21
Example:What is the heart rate ? • Are the RR-intervals constant? • RR-intervals are approximately 3 ‘big’ squares apart. • Thus, the heart rate is: 300 ÷ 3 = 100 beats per minute. Count the number of squares between two consecutive R-waves… 22
Calculating Heart Rate (HR) ‘Counting squares’ ‘Accurate measurement’
Calculating Heart Rate (HR) • Measure the shortest and the longest distance in mm, and divide 1,500 by each measurement, for example: • Shortest distance measured = 10 mm • Longest distance measured = 15 mm • Then 1,500 10 = 150 and 1,500 15 = 100 • Thus, the HR = 100-150 beats per minute
Correct answer: • Shortest measurement = 16 mm • Longest measurement = 19 mm Remember: Each small square represents 0.04 s, and 1,500 small squares represent one minute on the horizontal axis. Therefore: • 1,500 16 = 93.75 (~ 94 beats per min.) • 1,500 19 = 78.95 (~ 79 beats per min.) Thus, this patient’s heart rate (HR) is 79 to 94 beats per minute.
Calculating Variance in HR • Following from the previous example, subtract the shortest distance measured, from the longest distance measured (i.e. 150 mm – 100 mm = 50 mm). • Then, multiply the answer by 0.04 s (i.e. 50 0.04 = 2.0 seconds). • Normal physiological variance should be 0.12 seconds.
Correct answer: • Shortest measurement (RR-interval) = 16 mm • Longest measurement (RR-interval) = 19 mm Therefore: • 19 mm – 16 mm = 3 mm • 3 mm 0.04 s = 0.12 s (i.e. the upper limit of normal) Normal physiological variance: 0.12 s.
The ‘PQRSTU-complex’ Summary: P-wave and PR-interval: Represents atrial depolarisation – Normal: ~ 0.10 s in duration, with an amplitude of 0.50 to 2.50 mm. PR-interval is measured from the beginning of P-wave to the beginning of the QRS-complex (whether this a Q-wave or an R-wave) – Normal: 0.12 to 0.20 s in duration. Digoxin prolongs the PR-interval, effectively causing a 1st-degree AV-block, which will worsen in the event of digitalis toxicity.
(Cont’d): QRS-complex and ST-segment: Represents depolarisation of the ventricles Ventricular contraction – Normal: 0.08 to 0.12 s in duration; amplitude of 5 to 15 mm. ST-segment is the interval between the end of the QRS-complex and the beginning of the T-wave – Normal: on the isoelectric line (‘electric silence’); deviation of < 1 mm on either side. T-wave: Should be a positive deflection (except in aVR, V1 and V2). Represents repolarisation of the ventricles. Normal: 0.10 to 0.25 s in duration; amplitude < 5 mm.
QT-interval: Is measured from the beginning of QRS-complex to the end of T-wave; requires rate-correction for heart rate (QTc). Certain drugs may prolong the QTc (i.e. cardiotoxicity) and elicit torsades de pointes. Example of QT-interval correction: Bazett’s formula. (Cont’d):
U-wave:? (not necessarily present on all normal ECGs). RR-interval: Interval between two consecutive R-waves. Each R-wave should immediately precede a contraction of the ventricles. We use the RR-interval to calculate HR (heart rate); heart monitors “beep” whenever R-waves are recognised. Remember: Electromechanical dissociation (EMD)… (Cont’d):
[Measured]QT-interval (s) QTc (s) = RR-interval(s) Rate Correction of the QT-interval Bazett’s Formula:
Correct answer: • Measurement of the QT-interval = 9.5 mm • Therefore: QTm (s) = 9.5 mm 0.04 s = 0.38 s Using Bazett’s formula: • Shortest RR-interval: 16 mm 0.04 s = 0.64 s • Longest RR-interval: 19 mm 0.04 s = 0.76 s Thus: • QTc (s) = 0.38 s 0.64 s = 0.475 s (~ 0.48 s) • QTc (s) = 0.38 s 0.76 s = 0.437 s (~ 0.44 s) A normal QT-interval (corrected for HR) should measure between: 0.35 and 0.45 s.
Cardiac Axis Determination Complexes moving towards one another ‘Positive’ complexes Complexes deflecting away from one another Normal axis Left axis deviation Right axis deviation
Atrial P-wave Variants Right Axis Deviation Normal Left Axis Deviation II V1 Cardiac Axis Determination
Ventricular Hypertrophy Ventricular muscle hypertrophy Increased QRS-voltages in V1 and V6, Lead I and aVL May need to change the tracing to half of the normal standardisation T-wave changes in the opposite direction to the QRS-complexes Associated axis-deviation Associated atrial hypertrophy
Blood Supply to the Heart RCA LCX LAD RCA LCA
The heart has four surfaces: Anterior surface: LAD, Left Circumflex (LCx) Left-lateral surface: LCx, and partly via LAD Inferior surface: RCA, terminal portion of the LAD Posterior surface: RCA, branches of the LCx. (R) and (L) coronary arteries arise from the root of the aorta (just above the aortic valve opening). Blood Supply to the Heart
ST-segment Abnormalities Source: Bing Images, at http://www.bing.com/images
Lead aVR Flip the ECG vertically
? ? Lead aVL ?