Download
1 / 34
340 likes | 510 Vues
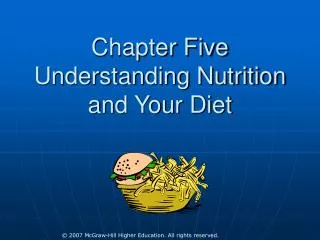
Understanding Nutrition. Chapter 8 - Energy Balance and Body Composition By A. Fellah, Ph.D. Energy Balance. When energy in balances with energy out, a person’s body weight is stable. For each 3500 kcal eaten in excess, a lb of body fat is stored.

E N D
Understanding Nutrition Chapter 8 - Energy Balance and Body Composition By A. Fellah, Ph.D.
Energy Balance When energy in balances with energy out, a person’s body weight is stable. For each 3500 kcal eaten in excess, a lb of body fat is stored. The rate of wt. loss for overweight people is 0.5-2 lbs a week or 10% of body weight over 6 months.
Energy in: the kcalories Foods Provide • Food Composition: • Bomb calorimeter: an instrument that measures the heat energy released when foods are burned, thus providing an estimate of the potential energy of foods. • A food containing 12g CHO, 5g fat, and 8g protein would provide 48 CHO kcalories, 45 fat kcalories, and 32 protein kcalories, a total of 125 kcalories.
Bomb Calorimeter • When food is burned, the chemical bonds between the carbons and hydrogens are broken, and energy is released in the form of heat. • The amount of heat generated provides a direct measure of the amount of energy stored in the food’s chemical bonds.
Food Intake: • Hunger: the physiological drive for food that initiates food-seeking behavior. • Appetite: the integrated response to the sight, smell, thought, or taste of food that initiate or delaying eating. • Satiation: the feeling of satisfaction and fullness that occurs during a meal and halts eating. Determines how much food is consumed during a meal. • Satiety: the feeling of satisfaction that occurs after a meal and inhibits eating until the next meal. Determines how much time passes between meals.
Overriding Hunger and Satiety Signals: • Eating in response to arousals is called stress eating. • Either negative or positive stress. • Some people cannot eat during times of stress. • Nutrients, Satiation, and Satiety: • Satiating: having the power to suppress hunger and inhibit eating. • Protein is the most satiating. • Message Central- The Hypothalamus: • Hypothalamus: a brain center that controls activities such as maintenance of water balance, regulation of body temperature, and control of appetite.
A cascade of regulation: hunger, appetite, satiation, and satiety
Hunger, Satiation, and Satiety: 1 of 2 Physiological influences, sensory influences, and cognitive influences.
Hunger, Satiation, and Satiety: 2 of 2 Postingestive influences and postabsorptive influences.
How Fat Influences Serving Size: 1 of 2 Peanuts Popcorn For the same size serving, peanuts deliver more than 15 times the kcalories and 20 times the fat of popcorn.
How Fat Influences Serving Size: 2 of 2 Popcorn offers twice the satiety of peanuts. For the same number of kcalories, a person can have a few high-fat peanuts or almost 2 cups of high-fiber popcorn. (This comparison used oil-based popcorn; using air-popped popcorn would double the amount of popcorn in this example.)
Energy Out: the kCalories the Body Spend Components of Energy Expenditure: • Basal Metabolism: The energy needed to maintain life when a body is at complete digestive, physical, and emotional rest. • Basal Metabolic Rate (BMR): the rate of energy used for metabolism under specified condition: after a 12 hr fast and restful sleep. (kcalories/kg body weight/hr). • Resting Metabolic Rate (RMR): a measure of a person at rest in a comfortable setting, but with less stringent criteria for the number of hrs fasting. RMR>BMR • Lean Body Mass: the weight of the body minus the fat content. • Voluntary activities: conscious and deliberate muscular work-lifting, walking, climbing,…….
2.Physical Activity: • Voluntary movement of the skeletal muscles and support systems. • Most variable and most changeable components. • Its influence on both weight gain and weight loss can be significant. 3. Thermic Effect of Food: (TEF) • An estimation of the energy required to process food (digest, absorb, transport, metabolize, and store ingested nutrients). • The sum of the TEF and any increase in the metabolic rate due to overeating is known as diet-induced thermo-genesis (DIT).
4. Adaptive Thermogenesis: • Adjustments in energy expenditure related to changes in environment such as extreme cold and to physiological events such as overheating, trauma and changes in hormone status.
Components of Energy Expenditure • The amount of energy spent in a day differs for each individual, but in general, basal metabolism is the largest component of energy expenditure (60 to 65%), and the thermic effect of food is the smallest (only 10 %). • The amount spent in voluntary physical activities has the greatest variability, depending on a person’s activity patterns.
Components of Energy Expenditures Each of these structures is made of 8 blocks. They weigh the same, but they are arranged differently. If you were to count the sides of these structures, you would find that the short, wide one has 24 sides and the tall, thin one has 34. Because the tall, thin structure has a greater surface area, it will lose more heat (expend more energy) than the short, wide one. Similarly, two people of different heights might weigh the same, but the taller, thin one will have a higher BMR (expending more energy) because of the greater skin surface.
Factors that Affect BMR • Age: slowing the BMR • Height: Tall, thin -----Higher BMR • Growth: Children and pregnant women ---Higher BMR • Body composition: The more lean tissue –Higher BMR. • Fever: raises the BMR. • Stresses: raises the BMR. • Environmental temp.: Both heat and cold---raise BMR. • Fasting/starvation: lowers the BMR. • Malnutrition: lower the BMR. • Hormones: thyroxin speed up or slow down BMR. • Smoking: nicotine increases energy expenditure. • Caffeine: increases energy expenditure. • Sleeping: BMR is lowest when sleeping.
Body weight, Body Composition, and Health • Body Composition:the proportions of muscles, bone, fat, and other tissue that make up a persons total body weight. Body weight = fat + lean tissue (including water). • Body Mass Index (BMI): an index of a person’s weight in relation to height, determined by dividing the weight (kg) by the square of the height (m). BMI = weight (kg) height (m)2 • Overweight: body weight above some standard of acceptable weight that is usually defined in relation to height.
Mortality Data The Effects of Body Weight and Smoking
Body Mass Index and Mortality Both underweight and overweight present risks of a premature death. This J-shaped curve describes the relationship between body mass index (BMI) and mortality and shows that optimal BMI is between 21 and 25 (some researchers extend this range from 19 to 27).
Body Fat and Weight 00 10 0 5 9 0
Fatfold Measures The assessor measures body fat by using a caliper to gauge the thickness of a fold of skin on the back of the arm (over the triceps), below the shoulder blade, and in other places (including lower body sites) and then compares with standards.
Hydrodensitometry The assessor measures body density by weighing the person first on land and then again while submerged in water. The difference between provides a measure of the body’s volume. A mathematical equation using the two measurements allows to calculate body density’ from which the percentage of body fat can be estimated
Bioelectrical Impedance The assessor measures body fat by using a low-intensity electrical current. Because electrolyte-containing fluids, which readily conduct an electrical current, are found primarily in lean body tissue, the leaner the person , the less resistance to the current. The measurement to electrical resistance is then used in a mathematical equation to estimate the percentage of body fat.
Summary • Energy balance is a simple yet complex formula. • Energy from food and beverages is measured by the use of the bomb calorimeter. • Hunger, appetite and satiety resulting from stimuli from nutrients and hormones play a role. Energy expenditure includes basal metabolism, physical activity, thermic effect of food and adaptive thermogenesis. • An individual can estimate energy requirements. • If the energy consumed equals the energy expended, the individual is in energy balance.
Summary • If energy consumed is more than energy expended, weight increases. • If energy consumed is less that energy expended, weight decreases. • A variety of techniques are used to measure body weight and body composition. • Height/weight charts and body mass indexes are used as Guidelines for weight. • Waist circumference and waist-to-hip measure body fat distribution.
Summary • Fatfold measures, hydrodensitometry and bioelectrical impedance measure body composition. • Body fat distribution and composition may be critical in determining risks to health, • Both overweight and underweight are conditions associated with health risk. • There is a strong relationship between obesity and cardiovascular disease, diabetes cancer.