Download
1 / 45
450 likes | 599 Vues
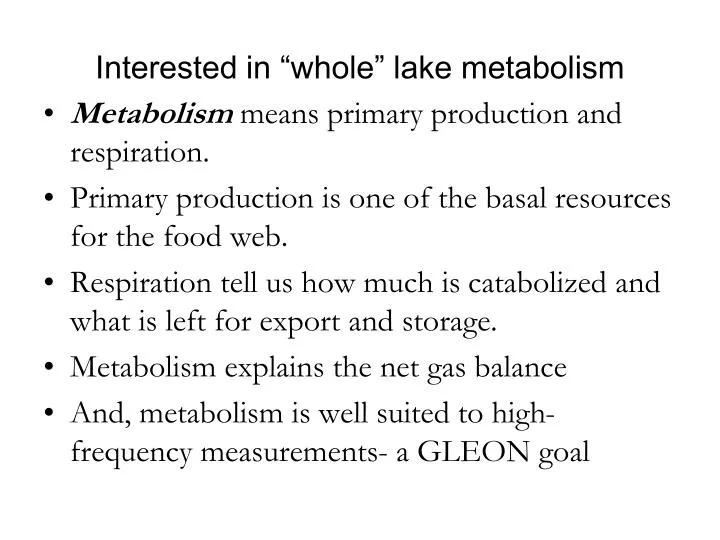
Interested in “whole” lake metabolism. Metabolism means primary production and respiration. Primary production is one of the basal resources for the food web. Respiration tell us how much is catabolized and what is left for export and storage. Metabolism explains the net gas balance

E N D
Interested in “whole” lake metabolism • Metabolism means primary production and respiration. • Primary production is one of the basal resources for the food web. • Respiration tell us how much is catabolized and what is left for export and storage. • Metabolism explains the net gas balance • And, metabolism is well suited to high-frequency measurements- a GLEON goal
Million Sonde March • Matthew C. Van de Bogert, Darren L. Bade, Stephen R. Carpenter, Jonathan J. Cole, Michael L. Pace, Paul C. Hanson, and Owen C. Langman • Lots of authors. • This talk for the GLEON Workshop, Lake Sunappe, January 2013.
Talk based on a recent paper • Spatial heterogeneity strongly affects estimates of ecosystem metabolism in two north temperate lakes • Van de Bogert et al. 2012 Limnol. Oceanogr. • We will discuss how having lots of sonde spatially arrayed in a lake affects estimates of GPP, R and NEP
Photosynthesis and respiration • Quick review • CO2 + H2O CH2O + O2 • GPP (gross primary production) – all photosynthesis independent of its fate. • R (total respiration, including plants and consumers) is the equation backwards. • GPP produces O2 in the light. • R consumes O2 in both the light and the dark
Definitions • GPP- gross photosynthesis • R –total respiration, including autotrophs • RH – heterotrophic (consumer) respiration • RA- autotrophic respiration. • NEP (net ecosystem production)= GPP-R • NPP (net primary production) = GPP-RA
Quiz • A darkened bottle is suspended in a lake for a few hours. The observed change in dissolved oxygen (DO) represents which process: • GPP, R, RH , RA, NEP or NPP • A clear bottle is suspended in the lake during daylight. Which process is measured with the DO change. • A dark and light bottle are suspended for 24-h, how do I calculate GPP and R and NEP?
Why free-water measurements? • No container effects • High temporal resolution • Offers promise of integrating over large(r) area • Advances in technology have made measurements easier, cheaper, more reliable YSI
Nighttime: Sonde Daytime: Estimating metabolism (GPP, R, NEP) from free-water dissolved oxygen Based on Odum (1956); Cole et al. 2000
Macrophyte shallows can be food web “hot spots” with different levels of GPP and R
DO cycles differently in Trapa beds (RED) than in main river channel (BLUE) or in SAV beds (GREEN) (Caraco and Cole 2003; Goodwin et al. 2008) In Trapa, no GPP in the water column; lots of R. O2 follows tide
Sonde site might matter • Where there is spatial heterogeneity, the location matters. • Where mixing is not instantaneous, the location matters. • The Hudson is an extreme case, but… • Nice example for lakes in Lauster et al. (2006) • These examples just compare a couple of sites. What if you had LOTs of sonde sites?
Million Man March, October 16, 1995 Goal: Foster a spirit of support and self-sufficiency within the black community
Million Mom March, Mother’s Day 2000 Goal: send Congress the message that women stand together for stronger national gun-control laws
Million Sonde March, July-August 2007 Goal: To determine how many sondes are needed to get a “good” estimate of lake metabolism
SONDE water ballet- calibrate at one site; disperse to many sites; check calibration at end at one site
Sparkling Lake 64ha n=35 Water depth (m)
Water Depth (m) N=35
Sparkling Lake- 35 sonde sites. Large spatial variation in daily estimates of GPP and R. NEP less variable but still variable- sign changes with space. GPP R NEP
Peter Lake 2.5 ha n=27 Water depth (m)
Peter Lake- 27 sonde sites. Large spatial variation in daily estimates of GPP and R. NEP less variable but still variable- sign changes with space.
If you have only one sonde site, you have got problems. • Significant (ANOVA) difference among sites and days for both lakes for GPP and R and for NEP in Peter L. • NEP in Sparkling did not vary among sites. • Site and day together account for 25 to 63% of total variance. • Site, rather than day is the lion’s share of the explained variance in both lakes. This is disturbing. • And, the variance is not just significantly different, the variance is huge among sites.
Location, rather than date, accounts for most of the explained variance. The explained variance is only about 20-30% of the total variance. Van de Bogert et al. 2012
Between 14 and 37% of the sites were statistically different from the lake wide mean (both lakes combined) for GPP and R. NEP not as bad.
Littoral v pelagic- surprising results. • Areal GPP and R , GREATER in pelagic than littoral sites in BOTH LAKES. 25 to 47% higher. • Pelagic (areal) NEP > littoral in Sparkling, but not Peter. • Volumetric rates (GPP,R and NEP) greater in littoral than pelagic in Sparkling Lake • No difference in volumetric rates for Peter.
Variability and number of sondes • Let’s take a statisitcal sampling of the sonde data • Rarefaction approach • Goal: identify how combining data from multiple sensors influences the precision of the lake-wide metabolism estimates.
Rarefaction pseudocode • 1) Calculate metabolism (GPP, R, NEP) for each site and day. • 2) For k = 1 to n, where n equals the total number of sites where sensors were deployed; a) Randomly choose k sites from the pool of n sites. • b) Calculate average metabolism values (GPP, R, NEP) using the subset of k sensors. • c) Repeat 2a and 2b using another random subset of sites; continue repeating the procedure until either 1000 unique subsets have been sampled or the maximum number of subsets (given by the binomial coefficient nCk) has been reached, whichever is less. • d) Calculate the mean and standard deviation of the repeated measures of the mean values using k sites. • e) Repeat 2a through 2d for the next value of k.
Rarefaction results for both lakes. GPP, R about 50 to 100 mmol m-2d-1 in either lake. To get SD to 20% of mean takes a lot of sondes. Fewer for NEP. Dashed lines are SD attributable only to DATE.
Suppose we make some rules about choosing sites • Instead of choosing sites randomly, specify the mix of pelagic and littoral sites. • Then basically repeat the previous analysis. • “Habitat targeted rarefaction”
GPP results shown but R and NEP similar. Van de Bogert et al. IN PRESS. Lowest SD occurs when proportion pelagic of deployed sondes matches the proportion of pelagic area in the lake.
What this means • With limited numbers of sondes, placement matters • In Peter Lake maybe 5 to 7 sensors, placed correctly, gives a low enough SD for GPP, R and NEP • In Sparkling Lake, this takes 10 to 14 sensors. • Maybe we are asking the wrong questions with sondes. • Maybe sondes can’t give you good daily values for a whole lake? • How well do we do over sites if we average over time?
100 GPP 0 1 2 3 4 5 6 7 8 9 50 15 16 17 18 19 20 21 22 23 24 25 26 27 10 11 12 13 14 All Pairs Tukey-Kramer Site 0.05 Peter Lake GPP aggregated by time.
0 R -100 1 2 3 4 5 6 7 8 9 10 11 12 13 14 15 16 17 18 19 20 21 22 23 24 25 26 27 50 All Pairs Tukey-Kramer Site 0.05 Peter Lake R aggregated by time.
200 100 GPP 0 -100 8 9 1 2 3 4 5 6 7 10 11 12 13 14 15 16 17 18 19 20 21 22 23 24 25 26 27 28 29 30 31 32 33 34 35 50 All Pairs Tukey-Kramer Site 0.05 Sparkling Lake GPP aggregated by time.
400 300 200 Resp 100 0 -100 2 3 4 5 6 7 8 9 1 10 11 12 13 14 15 16 17 18 19 20 21 22 23 24 25 26 27 28 29 30 31 32 33 34 35 50 All Pairs Tukey-Kramer Site 0.05 Sparkling Lake R aggregated by time.
Sparkling NEP Peter NEP
Implications for GLEON • The Million Sonde March is potentially problematic for GLEON. • We probably should not expect to produce meaningful daily or sub-daily estimates of GPP or R at the scale of the whole lake from a single site. • We probably can produce meaningful seasonal or monthly means from single sites. (Maybe)
Questions for GLEONITES and GLEONOIDS • Which mechanisms are responsible for the spatial variability in sonde metabolism estimates • It his variability real? • Would good physical models of water movement make the variability go away (I say no to this one)