Download

1 / 21
210 likes | 388 Vues
SCUD. Diagnostic Surface Currents SCUD and application to marine debris. Jan Hafner and Nikolai Maximenko jhafner@hawaii.edu, maximenk@hawaii.edu IPRC/SOEST University of Hawaii. Hydrodynamics of Marine Debris workshop 5IMDC – 20 March 2011 Honolulu, Hawaii. Outline . Motivation

E N D
SCUD Diagnostic Surface Currents SCUD and application to marine debris Jan Hafner and Nikolai Maximenko jhafner@hawaii.edu, maximenk@hawaii.edu IPRC/SOEST University of Hawaii Hydrodynamics of Marine Debris workshop 5IMDC – 20 March 2011 Honolulu, Hawaii
Outline • Motivation • Methodology • Data • Model formulation • Application to Marine Debris • Future
Motivation • Ocean Surface Currents – important factor in marine debris problem • Direct measurements difficult – few in situ observations • Utilize satellite data to arrive with surface ocean currents • supported by the following agencies: • NASA Physical Oceanography Program (Ocean Surface Topography Science Team) • US National Fish and Wildlife Foundation • JAMSTEC • NOAA sponsoring IPRC • Our direct motivation is from applications on marine debris
Methodology • Task: to develop a simple diagnostic model of surface ocean currents to fit drifters' trajectories • Input parameters: AVISO sea level anomaly (geostrophic current component) • Ocean surface wind data: daily QSCAT – wind driven current component ( Ekman)
DATA • Drifter data: AOML - Atlantic Oceanographic and Meteorological Laboratory www.aoml.noaa.gov • 8058 drifters, drogued at 15m • from 1979 till 2008, interpolated on 6 hourly intervals
DATA • AVISO mean sea level anomaly maps: 1/3 degree maps, merged product (up 4 satellites), weekly time frequency, starting Oct. 1992 (www.aviso.oceanobs.com) • MDOT - Mean Dynamic Ocean Topography, developed by Maximenko et al. (2009), ½ degree map produced using combined drifters, sea altimetry, GRACE and surface wind data, 1992-2002. • QSCAT 3-day moving averages of surface winds (10 m), ¼ degree daily maps July 1999 – November 2009, (www.ssmi.com)
Formulation of the diagnostic model USCUD(x,y,t) = U0 + uhx⋅∇xh(x,y,t) + uhy⋅ ∇yh(x,y,t) + uwx⋅wx(x,y,t) + uwy⋅wy(x,y,t) And similarly VSCUD(x,y,t) = V0 + vhx⋅∇xh(x,y,t) + vhy⋅ ∇yh(x,y,t) + vwx⋅wx(x,y,t) + vwy⋅wy(x,y,t) Where: USCUD , VSCUD- modeled ocean current components U0 , V0 - constant coefficient (mean) h - sea level anomaly wx, wy U and V component of surface wind (QSCAT) uhx, uhy , uwx , uwy - U component coefficients corresponding to sea level gradient and surface wind (function of x and y only) vhx, vhy , vwx , vwy- similarly corresponding V component coefficients
Formulation of the diagnostic model The coefficients are solved by minimizing the cost function: Fcost=Σ[(Udrifter ‐ USCUD)2 + (Vdrifter ‐ VSCUD)2] where the summation is over all drifters' data in a given lat/lon box (total 5,700,000 6-hourly data points).
RESULTS Local Scale
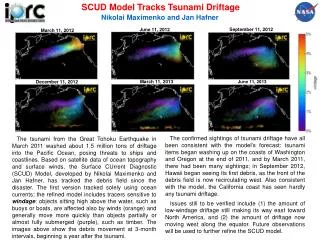
SCUD application on marine debris transport and convergence Where the marine debris goes? How it gets there ? Numerical Experiment: SCUD currents applied on ocean tracers released daily from coast and weighted by coastal population count
Animation of tracer transport by SCUD currents
SCUD model application on marine debris What model can do: zones of convergence structure of the patches trajectories = pathways What model cannot do: prediction vertical structure of marine debris coastal processes – emission and deposition of marine debris
Future – what is needed 1. operational SCUD product requires QSCAT to be replaced with ASCAT winds 2. global inventory of marine debris sources and sinks in the ocean and onshore is needed 3. effect of vertical mixing on floating debris needs to be included in the model 4. coastal dynamical processes, esp. high frequency and debris deposition processes, need to be considered in the model 5. validation of SCUD model results by in situ data needed Thank you
Data preprocessing • AVISO, MDOT and QSCAT wind data were interpolated on times and locations of 6-hourly drifters' data • Filtering out high frequency signal by Hanning cosine filter with halfwidth = inertial frequency, minimum frq. ~ 3 days (9°37' lat.)
Fit to the data Absolute misfit to drifters' data R.M.S. of cost function (m/s) Global average misfit : 0.162 m/s (0.118 m/s for USCUD and 0.107 m/s for VSCUD) Relative misfit to the drifters' data Ratio of cost function and drifters' R.M.Ss. Global average : 0.566 (0.541 and 0.653, for U and V components respectively)
Data and Access • ¼ degree surface currents maps: daily from 01Aug1999 till 19Nov2009 (span of QSCAT data) • SCUD dataset is open for free unrestricted use and distribution • Disseminated by APDRC servers : • http://apdrc.soest.hawaii.edu/projects/SCUD/ • LAS, LAS7, OpeNDAP, DChart • SCUD manual : http://apdrc.soest.hawaii.edu/projects/SCUD/SCUD_manual_02_17.pdf • SCUD users listserver:http://apdrc.soest.hawaii.edu/projects/SCUD/registration.html
From S.Pacific ST gyre To S.Pacific ST gyre From N.Pacific ST gyre To N.Pacific ST gyre From Hawaii To Hawaii Trajectories of real drifter starting from (left column) and ending in (right column) the South Pacific (top row), North Pacific (middle row), and Hawaii (bottom row).
Statistics R.M.S. of modeled velocities related to sea level (m/s) R.M.S. of modeled velocities related to surface winds (m/s)