Download
1 / 68
690 likes | 885 Vues
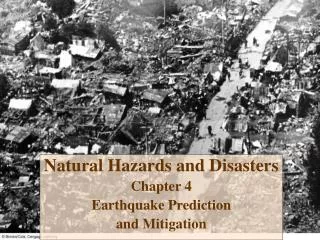
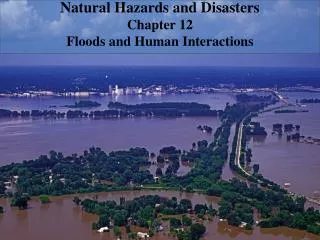
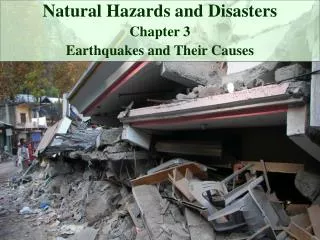
Natural Hazards and Disasters Chapter 11 Streams and Flood Processes. Too Close to a River. Disaster relief coordinator of Plains, Montana built new house on floodplain, 10 m back from banks of Clark Fork River

E N D
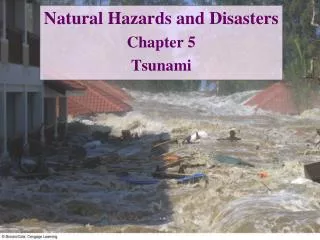
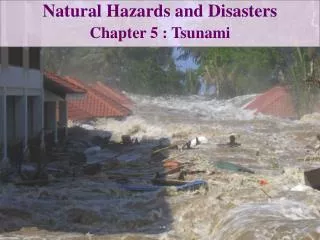
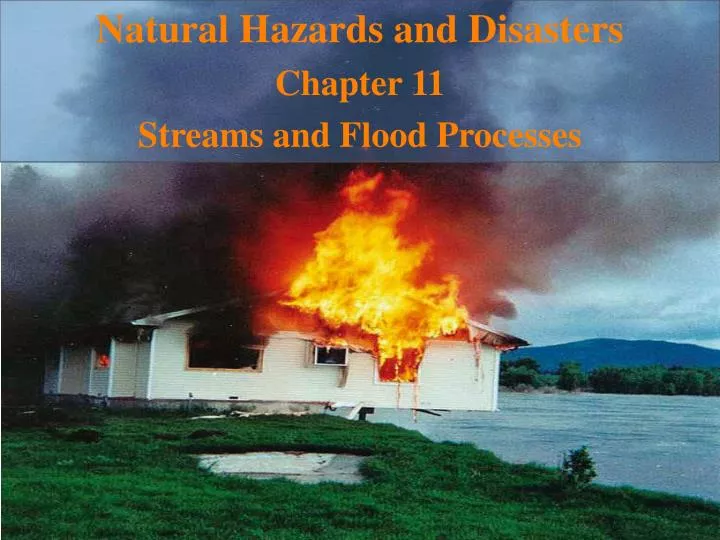
Natural Hazards and Disasters Chapter 11 Streams and Flood Processes
Too Close to a River Disaster relief coordinator of Plains, Montana built new house on floodplain, 10 m back from banks of Clark Fork River Spring runoff eroded bank until house was undercut and ground was too unstable to move house Local authorities burned house before it fell into river
Stream Flow and Sediment Transport • River is not fixed structure • Subject to natural processes • Changes course, floods • River is complex network of interconnected channels • Many small tributaries flowing to few large streams, flow to one major river • Valleys are eroded over thousands millions of years • Respond to changes in: • Climate • Amount and variability of flow • Size and amount of sediment particles supplied to channels
Stream Flow • Streams collect water and carry it across land to ocean • In humid regions, streams collect most water from groundwater seepage • Flow increases in downstream direction • Additional flow from tributary streams and groundwater enters channel • Streams accumulate surface water from watershed (drainage basin): upstream area from which surface water will flow toward channel
Stream Flow • Discharge: volume of water flowing per unit of time • Average water velocity multiplied by cross-sectional area of stream • Acoustic doppler current profiler: measures water velocity at hundreds of locations based on shift in sound frequencies due to moving particles
By the Numbers Total Flow of Stream Flow is average water velocity multiplied by cross-sectional area through which it flows: Q = VA where: Q = discharge or total flow (m3/sec) V = average velocity (m/sec) A = cross-sectional area = width x depth (m2)
Sediment Transport and Stream Equilibrium • Streams carry sediment downstream, eroding material in one place and depositing it in another • Graded stream changes to maintain dynamic equilibrium • Inflow and outflow of sediment is in balance • Cross section of stream adjusts to accommodate flow, sediment volume and grain sizes • Geometry of cross section is controlled by flow velocities and stream’s ability to carry sediment • Stream flowing through easily eroded sand and gravel at low flow: steep banks and broad, flat bottom • Stream flowing through resistant bedrock or fine silt and clay: narrow and deep channel
Sediment Transport and Stream Equilibrium • Streams adjust gradient (slope) in response to: • Water velocity • Sediment grain size • Total sediment load • Adjustments allow stream to transport supplied sediment over time
Sediment Transport and Stream Equilibrium • Streams begin high in drainage basin • Harder rocks, steeper slopes • Coarser grain sizes • Steeper gradient or faster water to move sediment • Downstream • Gradient decreases • Sediment is worn down to smaller sizes • Larger flow transports particles on gentler slope • Eventually stream reaches lake or ocean: base level below which stream cannot erode
Sediment Transport and Stream Equilibrium • Stream descends from steeper mountainous gradient onto broad valley bottom • Local base level • Rapid decrease in gradient causes stream to change from erosional mode to depositional mode • Forms alluvial fan: broad fan-shaped deposit • Stream reaches base level of lake or ocean • Abrupt drop in velocity causes sediments to sink down • Forms delta (underwater alluvial fan)
Sediment Load and Grain Size Streams can be provided with particles of any size from mud to giant boulders Volume and velocity of flow limit size and amount of sediment that stream can carry
Sediment Load and Grain Size • Coarser particles provide greater friction, slow water velocity along base of stream • Limit exists to amount of sediment (load) stream can carry • Large volumes of sediment from easily eroded source can overwhelm stream’s carrying capacity • Excess sediment is deposited in stream channel • Floodwaters carry more sediment
By the Numbers Velocity in Channel Velocity multiplied by channel roughness is proportional to average water depth of channel multiplied by square root of slope: V n = 1.49 R2/3 s1/2 where: n = Manning roughness coefficient (0.03 to 0.15) R = hydraulic radius (proportional to water depth) s = slope of channel
By the Numbers Carrying Capacity of a Stream Carrying capacity is proportional to discharge: L a = Qn where: L = suspended load transport rate (cm3/sec) Q = discharge (cm3/sec) n = exponent between 2.2 and 2.5
Sediment Transport and Flooding • Flooding is natural part of process of moving sediment and maintaining equilibrium • At high peak flood velocity and water depth: significant turbulence increases erosive power of stream, increases size and volume of sediment it can carry • Channel scour: depth of sediment eroded during floods • Flood increases water velocity increases frictional drag on stream bottom provides more force on streambed particles causes more erosion • Waning flow as flood declines coarser material in suspension drops out deposition raises streambed
By the Numbers Drag on Stream Bottom Drag on stream bottom is proportional to velocity squared: to= a v2 where: to= friction v = velocity a = area
Channel Patterns Meandering streams and braided streams are end members of range of stream behavior The way in which streams pick up and deposit sediment determines pattern of channel, determines the way channel moves over time and the type of characteristic flooding for type of stream
Meandering Streams Any irregularity that diverts water toward one bank helps erode that bank Thalweg: deep and highest-velocity part of stream Streams preferentially erode outside of meander bends Sediment deposited as point bar along inside of bend Meanders can come closer and closer together until floodwater breaks through neck between them, creating cutoff straight channel and oxbow lake in abandoned meander
Meandering Streams • Size and shape of river meanders: • Meander wavelength ~ 12 x channel width or 1.6 x meander belt width or 4.5 meander radius of curvature • Meander width ~ 2.9 x meander radius of curvature • Meander arc length related to channel width and depth • Relationships hold regardless of stream size
Meandering Channels • Sinuosity ratio: A measure of how much a channel meanders over a given span • SR = SL/VL • SR = Sinuosity ratio • SL = Stream length: The lineal length of the channel • VL = Valley length: The lineal length of the valley • SR can never be less than 1 • 1 would indicate a perfectly straight channel
Meandering Streams • Erosion and deposition of meanders over long term moves river back and forth to create broad valley bottom: floodplain • Slow water velocity at edge of deeper channel forms natural levee of sediments • Nearly continuous low ridge along edge of channel • May keep small floods within channel
Meandering Channels • Meander bends can become very exaggerated • Looping patterns can erode, migrating closer and closer to each other • Narrowing ‘neck’ of land eventually erodes away and forms a cutoff • Major loop is disconnected from the stream and stream is straightened • Oxbow lake is formed • Dried up oxbow lake is a meander scar
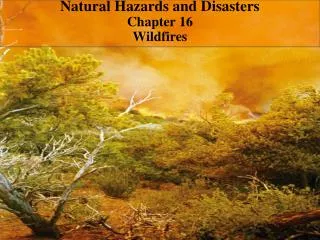
Braided Streams • Do not meander, instead form broad, multi-channel paths • Overloaded with sediment that is deposited in islands between small channels • Promoted by dry climate with little vegetation protecting slopes from erosion • Characterized by eroding banks, steep gradient, abundant stream bedload • Form alluvial fan where braided stream lowers gradient • Particularly dangerous flood areas
Braided Stream Aggradation
Bedrock Streams Develops when stream erodes down to resistant bedrock Abrupt change in gradient (knickpoint) from bedrock section to braided or meander section of stream High-gradient channels Deep, narrow cross-sections Carry turbulent, highly erosive flood flows Vortices or whirlpools can form and drill potholes in bedrock
Climate Controls on Stream Flow Large floods depend on large areas of humid air Tropical regions: high but brief rainfall rates Tropical cyclones, mid-latitude frontal systems, heavy rainfall of thunderstorms, seasonal monsoons cause significant flooding Floods more common after prolonged soaking of ground by rainfall or snowmelt
Climate Controls on Stream Flow Flood behavior depends on surface water interaction with groundwater Arid regions: losing streams lose water into ground, dry up between storms Everywhere else: in gaining streams, water flows from groundwater into stream, at rate determined by slope of water table and ease of flow through rocks
Flooding Processes • Amount of precipitation varies from year to year • Some precipitation flows as surface runoff during torrential rainfall • Floods most commonly initiated by heavy or prolonged rainfall • Also by rapid snowmelt, rain on frozen ground, break-up of ice-dam
Bankfull Channel Width, Depth, and Capacity- Start HERE Bankfull level: level at which water spills over banks Streams generally reach bankfull every 1 ½ to 3 years Increase in discharge during flood involves increase in water velocity, water depth and stream width
Precipitation Intensity and Surface Runoff • Rate of precipitation affects rate of runoff to streams and floods • Rapid runoff over surface: overland flow • Rapid flood peaks are most common in: • Areas with fine-grained soils or desert soils • Areas with near-surface bedrock or shallow groundwater
Floods on Frozen or Water-Saturated Ground Ground that is saturated or frozen causes most water to run off directly to stream Largest floods develop when heavy rain accelerates melting of snowpack During winter and early spring, ice can block stream channels North-flowing rivers have upstream thaw with flow restricted by downstream ice, causing floods
Flood Intensity Intensity of flood depends on discharge of floodwater and rate of rise of water Varies with time according to rate of runoff, shape of channel, distance downstream, number of tributaries Use hydrograph to plot volume of water over period of time Discharge rises steeply to flood crest (peak discharge), falls gently More rapid transfer of water to stream by urbanization or deforestation causes heightened and steepened hydrograph
Flood Intensity • Lag time between storm and resulting flood peak depends on: • Slope steepness • Basin area and shape • Spacing of drainage channels • Vegetation cover • Soil permeability • Land use • Upstream: higher flood peak, shorter lag time • Downstream: lower flood peak, longer lag time, longer flood duration
Flooding and Urbanization • Urbanization causes more of the watershed area to be impervious (water can’t percolate into the ground) • Less infiltration means more runoff • Storm sewers decrease lag time • More water is transported more quickly to the stream channel - combined effect: • Greater range in stream discharges • Increase in the frequency of flood events • Draining swamps • Natural recharge areas • Reduces native habitats
Stream Order • Stream order: number of tributaries to stream • First-order streams: small, lack tributaries • First-order streams join to form second-order streams, etc. • Low-order streams: • Water travels short distance to stream • Flood rapidly in storms • Less flood warning time • Higher-order streams: • Flood peak begins later, lasts longer • Flood warning time is longer
Flash Floods • Appear unexpectedly • Water levels rise dangerously • Highest flash-flood danger in semiarid, mountainous areas • Floodwaters may rush down channel from distant storm • Flood frequency recorded as recurrence interval • Average time between floods of given size • Larger flood discharges on given stream have longer recurrence intervals between floods
100-Year Floods and Floodplains • 100-year flood used by U.S. Federal Emergency Management Agency (FEMA) to establish regulations for building near streams • 100-year flood has 1% chance of happening in any given year (including year after similar event) • 100-year floodplain is area likely to be flooded by largest event in 100 years (on average) • Based on extrapolation from few large recorded events • Does not account for probable changes from upstream alterations to drainage basin, human activities
Recurrence Intervals and Discharge Statistical average number of years between flows of certain discharge is recurrence interval Inverse of recurrence interval is probability that certain discharge will be exceeded in any given year Calculated recurrence interval depends on total number of years in flood record and rank of flood in question Any new larger flood reduces rank, reduces recurrence interval
Recurrence Intervals and Discharge • Recurrence intervals DO NOT mean that a flood of X size happens every X years, e.g., a 100-year flood DOES NOT mean that a flood of a given discharge happens every 100 years on the dot, recurrence intervals are PROBABILITY MEASUREMENTS!!! • A 100-year flood could happen two years in a row, although the PROBABILITY of that occurring is very small
By the Numbers Recurrence Intervals For given-size flood, recurrence interval is: T = (n+1)/m where T = recurrence interval n = total number of years in record m = rank of flood (largest flood = 1; second-largest flood = 2; etc.)
By the Numbers Recurrence Intervals Example: If largest flood on river at single location was in 1997 m1997 = 1 And have 87 years of records n = 87 Then recurrence interval for 1997 flood is T1997 = (87+1)/1 = 88 years (average)
By the Numbers Recurrence Intervals Example: If in 2007 slightly larger flood occurs, m2007 = 1 and m1997 = 2 Corrected recurrence interval for 1997 flood is T1997 = (97 + 1)/2 = 98/2 = 49 years (average) If in 2011 slightly larger flood occurs, m2011 = 1, m2007 = 2 and m1997 = 3 Corrected recurrence interval for 1997 flood is T1997 = (101 + 1)/3 = 102/3 = 34 years (average) Dramatic changes in calculated recurrence interval for same 1997 flood, from 88 years to 34 years