Download

1 / 25
260 likes | 611 Vues
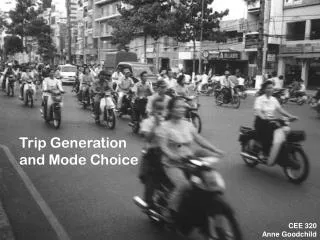
Trip Generation and Mode Choice. CEE 320 Anne Goodchild. Trip Generation. Purpose Predict how many trips will be made Predict exactly when a trip will be made Approach Aggregate decision-making units (households) Categorized trip types Aggregate trip times (e.g., AM, PM, rush hour)

E N D
Trip Generationand Mode Choice CEE 320Anne Goodchild
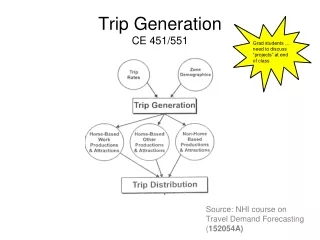
Trip Generation • Purpose • Predict how many trips will be made • Predict exactly when a trip will be made • Approach • Aggregate decision-making units (households) • Categorized trip types • Aggregate trip times (e.g., AM, PM, rush hour) • Generate Model
Motivations for Making Trips • Lifestyle • Residential choice • Work choice • Recreational choice • Kids, marriage • Money • Life stage • Technology
Reporting of Trips - Issues • Under-reporting trivial trips • Trip chaining • Other reasons (passenger in a car for example) • Time consuming and expensive
Trip Generation Models • Linear (simple) • Number of trips is a function of user characteristics • Poisson (a bit better)
Poisson Distribution • Count distribution • Uses discrete values • Different than a continuous distribution
Poisson Ideas • Probability of exactly 4 trips being generated • P(n=4) • Probability of less than 4 trips generated • P(n<4) = P(0) + P(1) + P(2) + P(3) • Probability of 4 or more trips generated • P(n≥4) = 1 – P(n<4) = 1 – (P(0) + P(1) + P(2) + P(3)) • Amount of time between successive trips
Poisson Distribution Example Trip generation from my house is assumed Poisson distributed with an average trip generation per day of 2.8 trips. What is the probability of the following: • Exactly 2 trips in a day? • Less than 2 trips in a day? • More than 2 trips in a day?
Example Calculations Exactly 2: Less than 2: More than 2:
Example Recreational or pleasure trips measured by λi (Poisson model):
Example • Probability of exactly “n” trips using the Poisson model: • Cumulative probability • Probability of one trip or less: P(0) + P(1) = 0.52 • Probability of at least two trips: 1 – (P(0) + P(1)) = 0.48 • Confidence level • We are 52% confident that no more than one recreational or pleasure trip will be made by the average individual in a day
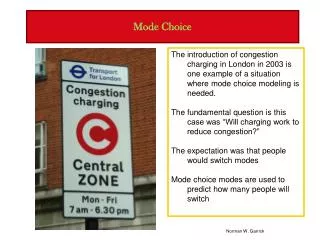
Mode Choice • Purpose • Predict the mode of travel for each trip • Approach • Categorized modes (SOV, HOV, bus, bike, etc.) • Generate Model
Dilemma Qualitative Dependent Variable Explanatory Variables
Dilemma = observation 1 Walk to School (yes/no variable) 1 = no, 0 = yes 0 0 10 Home to School Distance (miles)
A Mode Choice Model • Logit Model • Final form Specifiable part Unspecifiable part s = all available alternatives m = alternative being considered n = traveler characteristic k = traveler
Discrete Choice Example • Buying a golf ball • Price • Driving distance • Life expectancy
Typical ranges Consumer’s ideal • Average Driving Distance: 225-275 yards • Average Ball Life: 18-54 holes • Price: $1.25-$1.75 Producer’s ideal • Average Driving Distance: 225-275 yards • Average Ball Life: 18-54 holes • Price: $1.25-$1.75
250 yards 54 holes $1.75 225 yards 36 holes $1.25 Would you rather have: If we ask enough of these questions, and respondent has some underlying rational value system, we can identify the values for each attribute that would cause them to answer the way that they did.
Utilities • What is the respondent willing to pay for one additional yard of driving distance? • What is the respondent willing to pay for one additional hole of ball life? • Assume no value for the bottom of the range • Calculate their utility for any ball offering, then the probability they will choose each offering.
Concerns • All attributes must be independent • Must capture everything that is important (or use constant) • Can present a set of choices and predict population’s response • Offer complete set of choices • Red bus/blue bus