Download
1 / 15
150 likes | 305 Vues
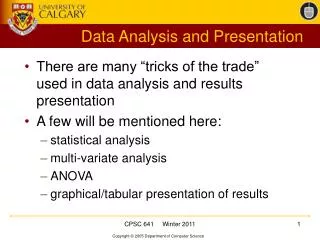
Analysis, Presentation, and Uses of Data, Part I. Overview. Data analysis Importance of objective data analysis How to analyze labor statistics Visual presentation of data Users and uses of labor statistics Dissemination. Analysis : The Link between Data and Understanding.

E N D
Overview Data analysis Importance of objective data analysis How to analyze labor statistics Visual presentation of data Users and uses of labor statistics Dissemination
What we want: Answers to questions Are people able to find work? Are good jobs available? Who is faring best in the labor market? Who is struggling? How does the current situation compare to the past?
How do we go from data… to assessment?
Why do analysis? Educate officials, policymakers, and others: • Describe a situation • Classify the component parts of a situation • Help assess why something happened • Forecast/project what may happen in the future Source: www.cartoonstock.com
Objective Analysis Impartiality evident by values in action Unbiased in subject matter and presentation • Is the glass half full or half empty? • It is a .5 liter glass with 250 ml of liquid Scientific and transparent methods Equal access to data for all users
Data Analysis Focus on data analysis at these times: • When the survey is in the design phase, • When detailed plans are being made for data collection, • After the data are collected, and • As the report is being written and reviewed.
Data Analysis Know the limitations of the data: • Sample size • Trends • Sampling error • Nonsampling error • Impacts of redesigns and other changes • Breaks in a series
Role of Analyst Judgment Experience Understanding of situation Technical ability Source: www.it-career-coach.net
Levels of analysis Descriptive • simplest; present facts; summarization Causal • examine selected variables; more difficult to attribute causation Projection and forecasting • most complex
Levels of analysis Descriptive • simplest; present facts; summarization Causal • examine selected variables; more difficult to attribute causation Projection and forecasting • most complex
Levels of analysis Descriptive • simplest; present facts; summarization Causal • examine selected variables; more difficult to attribute causation Projection and forecasting • most complex
Quantitative analysis Measures of central tendency • Mean • Median • Mode Measures of dispersion • Range • Standard deviation Measures of association